## Heatmap: Accuracy Matrix for Digit Recognition
### Overview
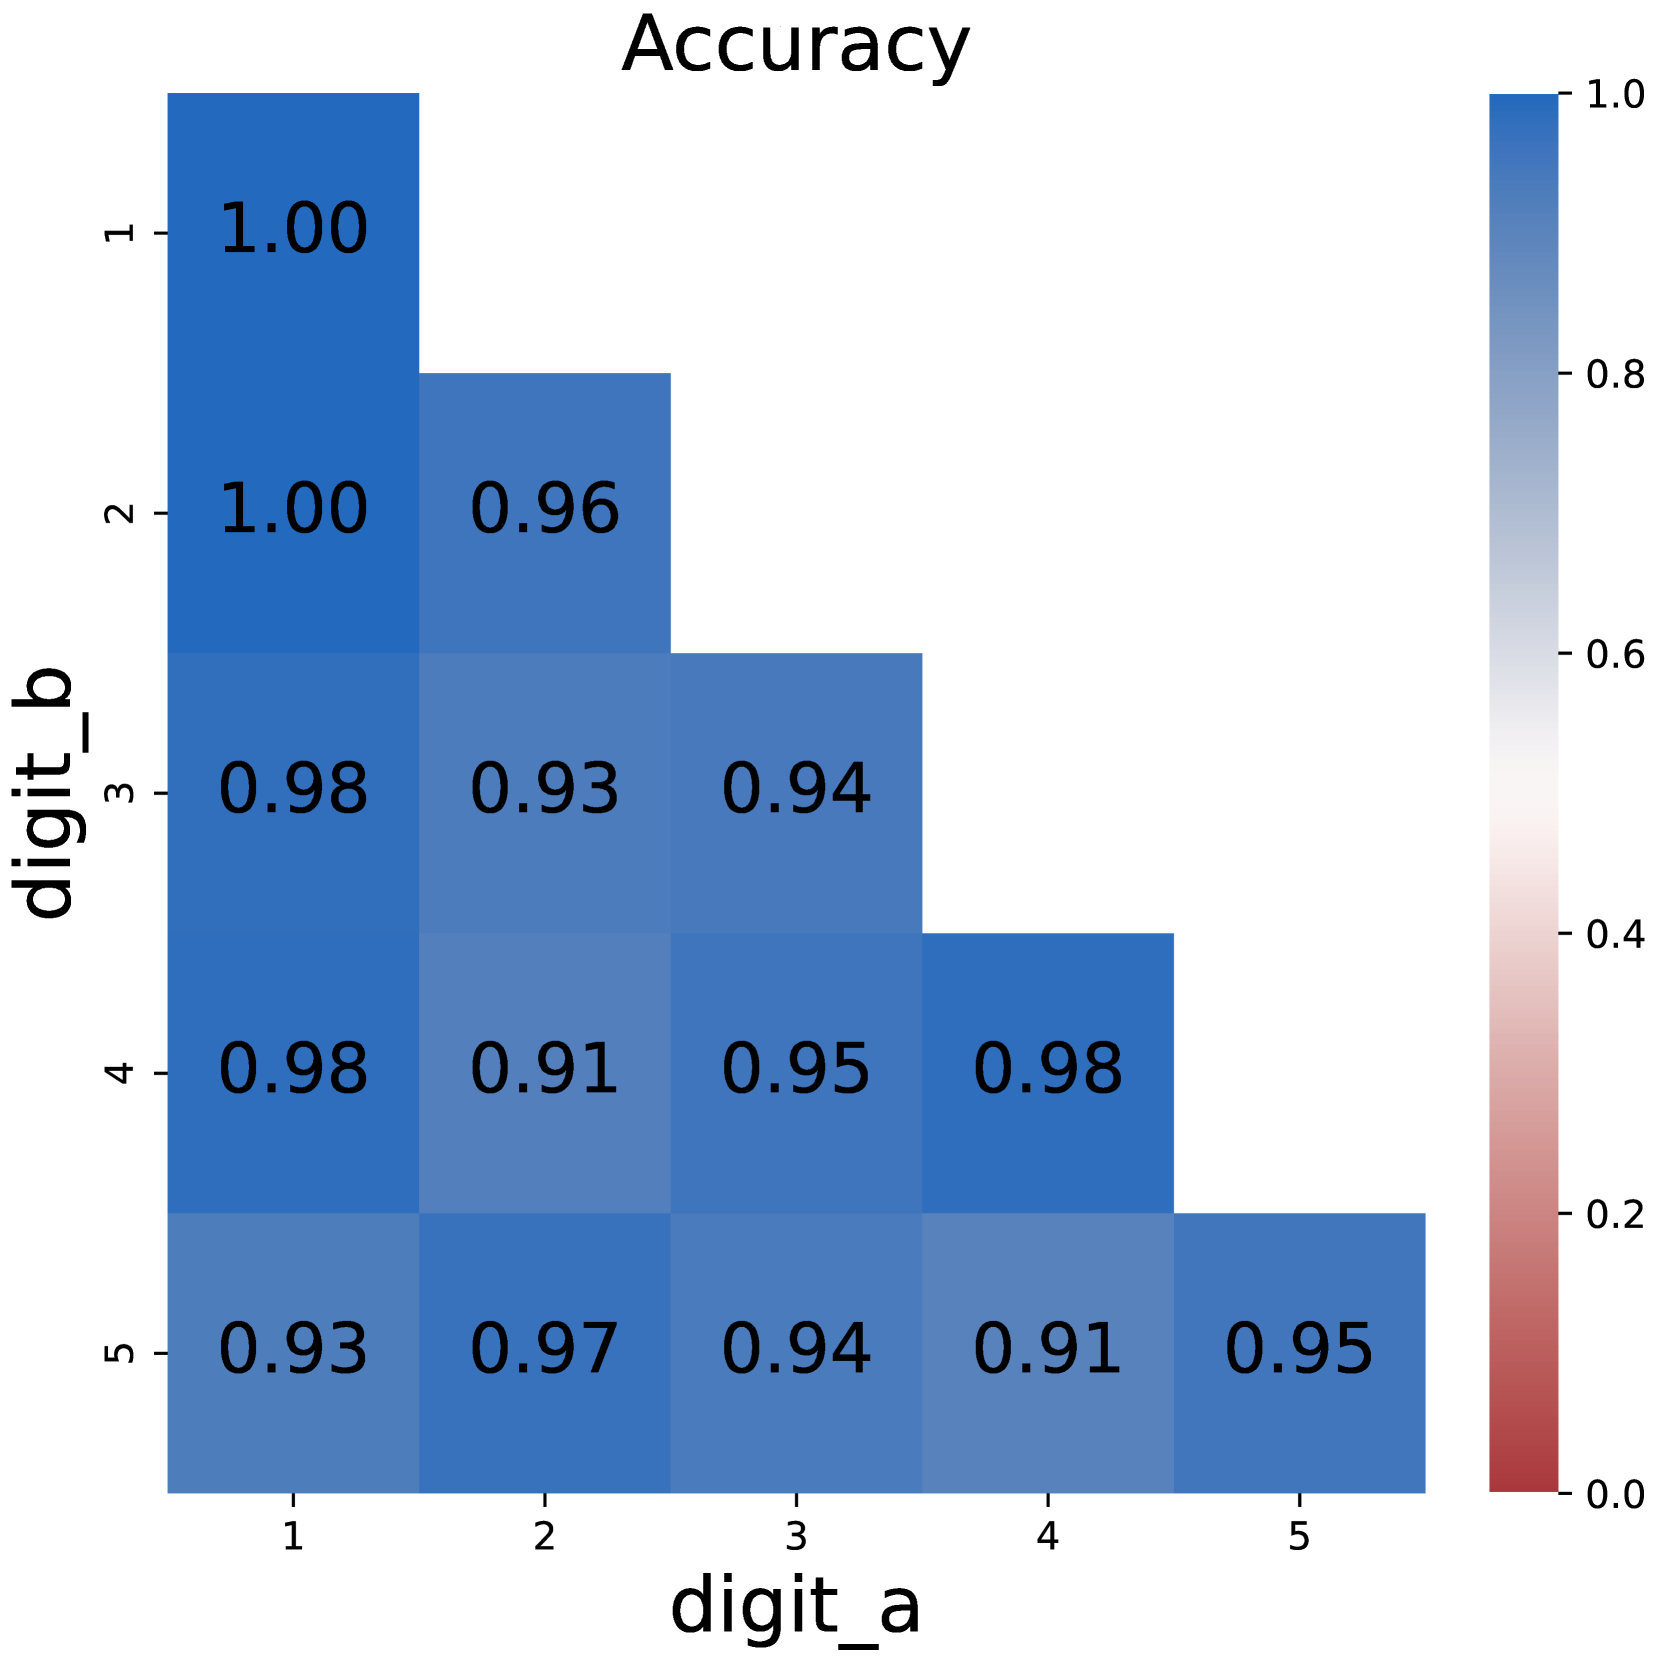
The image displays a heatmap titled "Accuracy" visualizing the performance of a digit recognition system. The matrix compares accuracy scores between predicted digits (`digit_a`) and true digits (`digit_b`), with values ranging from 0.0 (red) to 1.0 (blue) on a color gradient scale. The heatmap reveals high accuracy for correct digit matches and moderate accuracy for similar digits.
### Components/Axes
- **X-axis (digit_a)**: Predicted digit labels (1–5).
- **Y-axis (digit_b)**: True digit labels (1–5).
- **Legend**: Vertical colorbar on the right, mapping values to colors:
- **Blue** (top): High accuracy (1.0).
- **Red** (bottom): Low accuracy (0.0).
- **Axis Titles**:
- X-axis: "digit_a" (bold, black text).
- Y-axis: "digit_b" (bold, black text).
- Title: "Accuracy" (centered, bold, black text).
### Detailed Analysis
- **Diagonal Values** (digit_a = digit_b):
- (1,1): 1.00 (darkest blue).
- (2,2): 0.96.
- (3,3): 0.94.
- (4,4): 0.98.
- (5,5): 0.95.
- **Off-Diagonal Values** (digit_a ≠ digit_b):
- Similar digits (e.g., 1 vs. 2, 2 vs. 3) show moderate accuracy (0.91–0.97).
- Dissimilar digits (e.g., 1 vs. 5) show lower accuracy (0.93–0.95).
- **Color Gradient**: Darker blue dominates the diagonal, transitioning to lighter blue/white off-diagonal, with no red cells.
### Key Observations
1. **Perfect Matches**: The diagonal (digit_a = digit_b) achieves near-perfect accuracy (0.94–1.00).
2. **Similar Digits**: Adjacent digits (e.g., 2 vs. 3) maintain high accuracy (0.93–0.97).
3. **Dissimilar Digits**: Non-adjacent digits (e.g., 1 vs. 5) show slightly reduced accuracy (0.93–0.95).
4. **Consistency**: No cell falls below 0.91, indicating robust performance across all digit pairs.
### Interpretation
The heatmap demonstrates a digit recognition system with **high overall accuracy**, particularly for correct matches. The diagonal dominance suggests the model excels at identifying identical digits, while off-diagonal values indicate it generalizes well to similar digits (e.g., 2 vs. 3). The minimal drop in accuracy for dissimilar digits (e.g., 1 vs. 5) implies the system avoids significant confusion between non-adjacent digits. This pattern is typical of models trained on digit datasets like MNIST, where spatial proximity between digits correlates with feature similarity. The absence of red cells confirms no catastrophic failures in digit classification.