## Heatmap: Accuracy
### Overview
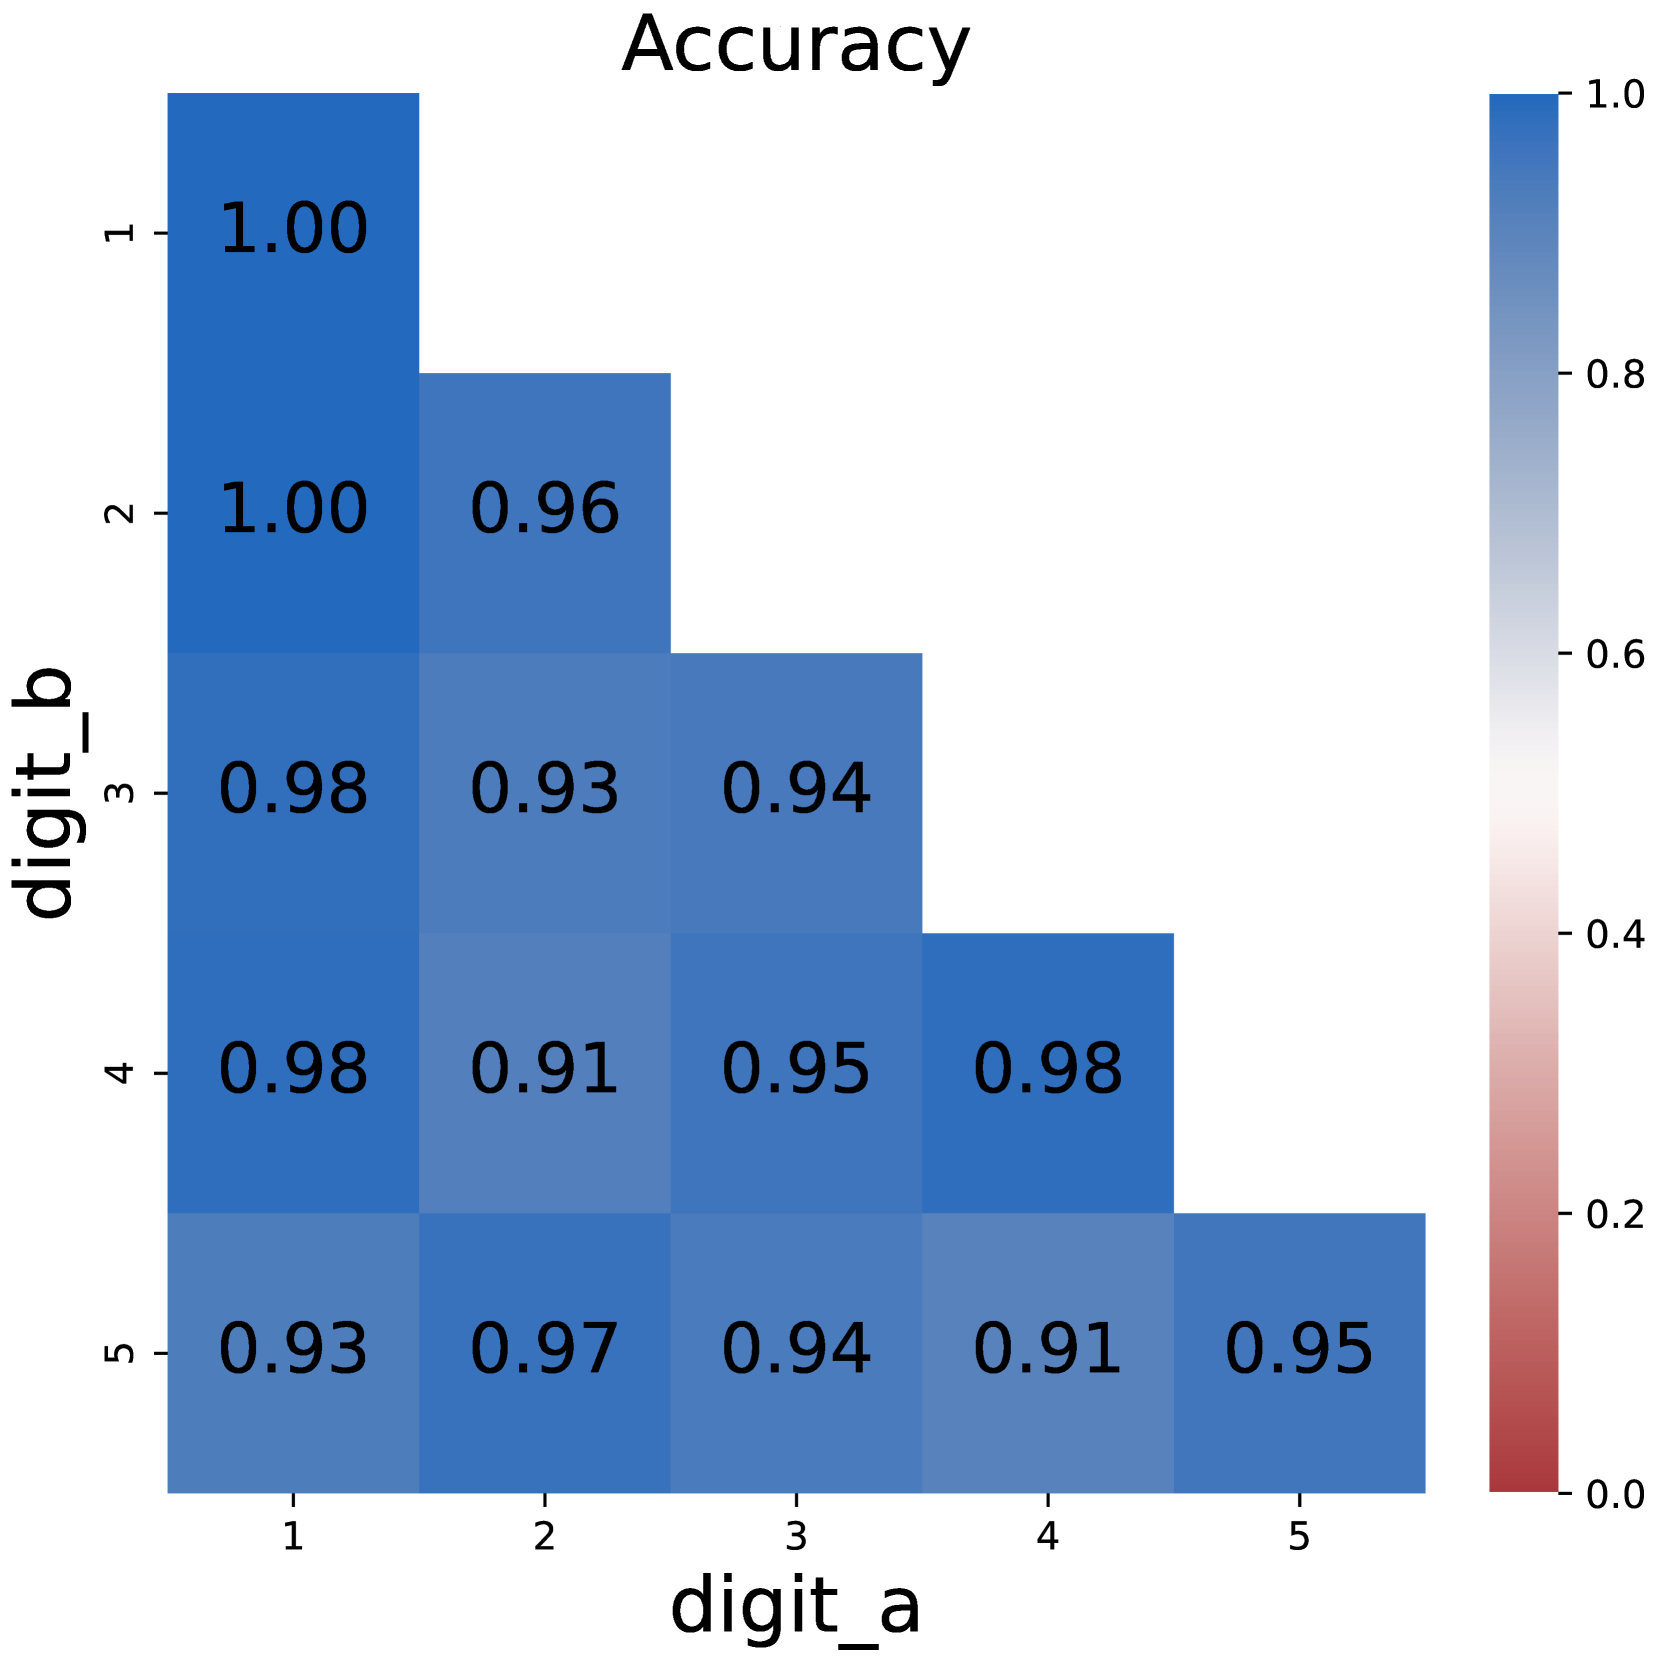
The image is a heatmap displaying accuracy values for different combinations of 'digit_a' and 'digit_b'. The heatmap is triangular, with values only present above and including the diagonal. The color intensity represents the accuracy, ranging from red (low accuracy) to blue (high accuracy), as indicated by the colorbar on the right.
### Components/Axes
* **Title:** Accuracy
* **X-axis (Horizontal):** digit\_a, with ticks at 1, 2, 3, 4, and 5.
* **Y-axis (Vertical):** digit\_b, with ticks at 1, 2, 3, 4, and 5.
* **Colorbar:** Ranges from 0.0 (red) to 1.0 (blue), with intermediate values of 0.2, 0.4, 0.6, and 0.8.
### Detailed Analysis
The heatmap displays the following accuracy values for each combination of digit_a and digit_b:
* **digit_a = 1:**
* digit_b = 1: 1.00 (dark blue)
* digit_b = 2: 1.00 (dark blue)
* digit_b = 3: 0.98 (dark blue)
* digit_b = 4: 0.98 (dark blue)
* digit_b = 5: 0.93 (blue)
* **digit_a = 2:**
* digit_b = 2: 0.96 (blue)
* digit_b = 3: 0.93 (blue)
* digit_b = 4: 0.91 (blue)
* digit_b = 5: 0.97 (blue)
* **digit_a = 3:**
* digit_b = 3: 0.94 (blue)
* digit_b = 4: 0.95 (blue)
* digit_b = 5: 0.94 (blue)
* **digit_a = 4:**
* digit_b = 4: 0.98 (dark blue)
* digit_b = 5: 0.91 (blue)
* **digit_a = 5:**
* digit_b = 5: 0.95 (blue)
### Key Observations
* The highest accuracy (1.00) is observed when digit_a and digit_b are both 1, and when digit_a is 1 and digit_b is 2.
* The accuracy values are generally high, ranging from 0.91 to 1.00.
* The heatmap is triangular, indicating that only the upper triangle of the matrix is filled.
### Interpretation
The heatmap visualizes the accuracy of a model or system in correctly identifying or matching digits 'a' and 'b'. The high accuracy values suggest that the system performs well in this task. The triangular shape of the heatmap implies that the accuracy is only measured when digit_b is greater than or equal to digit_a. This could be due to the nature of the task or the way the data was collected. The color gradient provides a quick visual representation of the accuracy, with darker blue indicating higher accuracy and lighter shades indicating lower accuracy.