## Bar Chart: Distribution of Good and Bad Answers by Model
### Overview
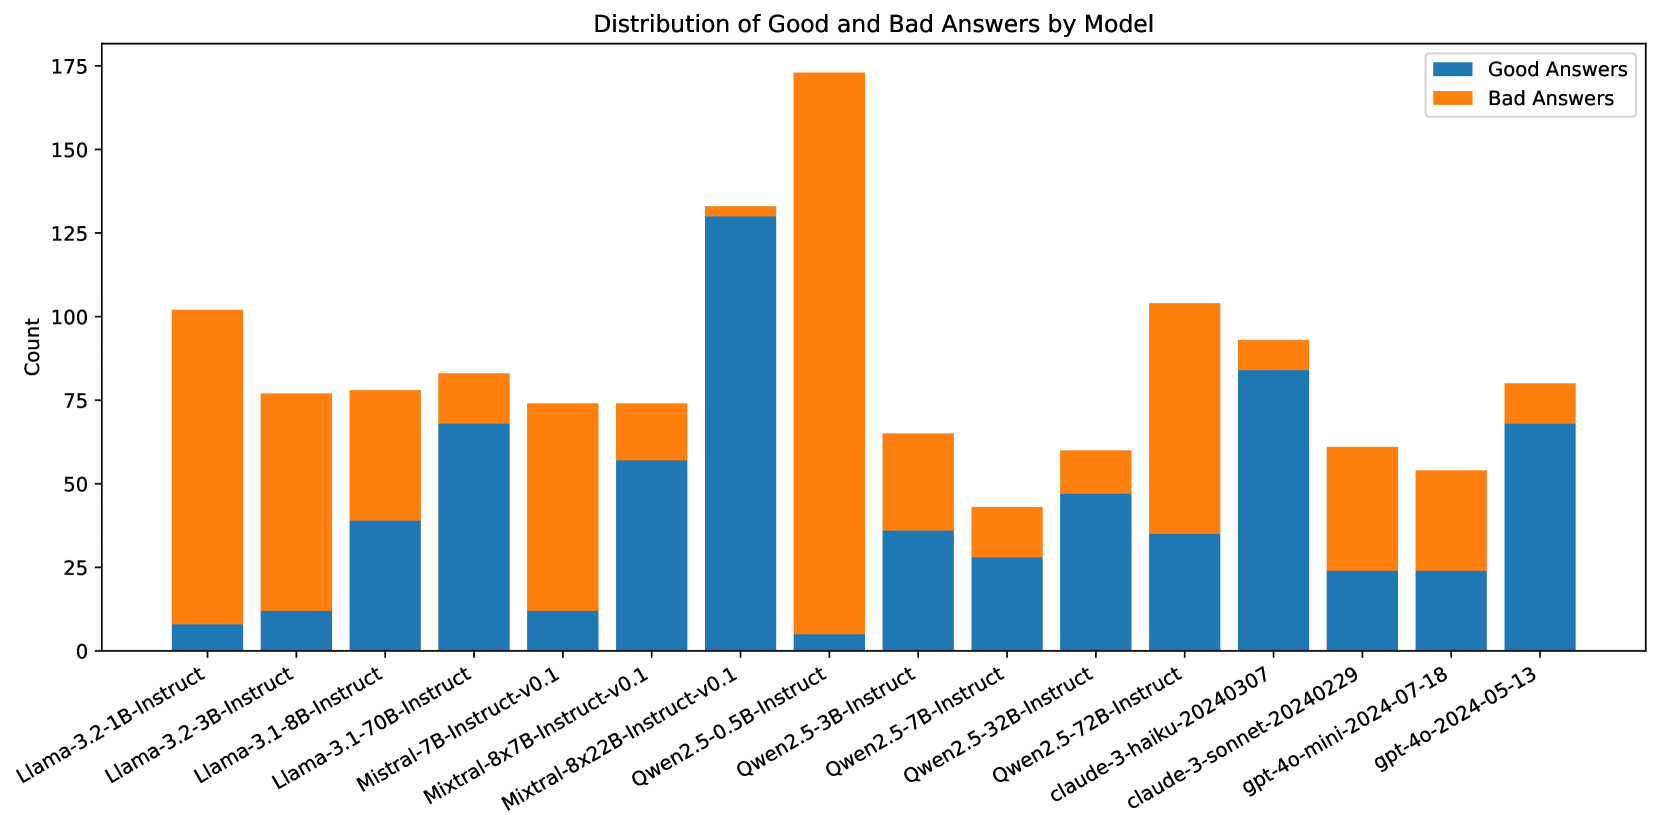
This bar chart visualizes the distribution of "Good Answers" and "Bad Answers" across various language models. The x-axis represents the different models, and the y-axis represents the count of answers categorized as either good or bad. Each model has two bars: one for good answers (blue) and one for bad answers (orange).
### Components/Axes
* **Title:** "Distribution of Good and Bad Answers by Model" (positioned at the top-center)
* **X-axis Label:** Model names (Llama-2-3.2-1B-instruct, Llama-2-3.2-3B-instruct, Llama-3.1-8B-instruct, Mistral-7B-instruct, Mixtral-8x7B-instruct-v0.1, Mixtral-8x22B-instruct-v0.1, Qwen2.5-0.5B-instruct, Qwen2.5-3B-instruct, Qwen2.5-7B-instruct, Qwen2.5-32B-instruct, Qwen2.5-72B-instruct, claude-3-haiku-20240307, gpt-4o-mini-2024-07-18, claude-3-sonnet-20240229, gpt-4o-2024-05-13)
* **Y-axis Label:** "Count" (ranging from 0 to 175)
* **Legend:** Located at the top-right corner, labeling the colors: "Good Answers" (blue) and "Bad Answers" (orange).
### Detailed Analysis
The chart consists of 15 models, each represented by two bars. The following data points are approximate, based on visual estimation:
* **Llama-2-3.2-1B-instruct:** Good Answers ≈ 10, Bad Answers ≈ 5
* **Llama-2-3.2-3B-instruct:** Good Answers ≈ 20, Bad Answers ≈ 10
* **Llama-3.1-8B-instruct:** Good Answers ≈ 30, Bad Answers ≈ 15
* **Mistral-7B-instruct:** Good Answers ≈ 40, Bad Answers ≈ 20
* **Mixtral-8x7B-instruct-v0.1:** Good Answers ≈ 60, Bad Answers ≈ 30
* **Mixtral-8x22B-instruct-v0.1:** Good Answers ≈ 130, Bad Answers ≈ 65
* **Qwen2.5-0.5B-instruct:** Good Answers ≈ 50, Bad Answers ≈ 25
* **Qwen2.5-3B-instruct:** Good Answers ≈ 70, Bad Answers ≈ 35
* **Qwen2.5-7B-instruct:** Good Answers ≈ 100, Bad Answers ≈ 50
* **Qwen2.5-32B-instruct:** Good Answers ≈ 150, Bad Answers ≈ 75
* **Qwen2.5-72B-instruct:** Good Answers ≈ 80, Bad Answers ≈ 40
* **claude-3-haiku-20240307:** Good Answers ≈ 45, Bad Answers ≈ 22
* **gpt-4o-mini-2024-07-18:** Good Answers ≈ 35, Bad Answers ≈ 17
* **claude-3-sonnet-20240229:** Good Answers ≈ 65, Bad Answers ≈ 32
* **gpt-4o-2024-05-13:** Good Answers ≈ 55, Bad Answers ≈ 27
**Trends:**
* Generally, the "Good Answers" bar is taller than the "Bad Answers" bar for most models, indicating a higher proportion of good answers.
* The count of both good and bad answers tends to increase with model size (as indicated by the model name).
* Mixtral-8x22B-instruct-v0.1 has the highest counts for both good and bad answers.
* Qwen2.5-32B-instruct has the highest count of good answers.
### Key Observations
* Mixtral-8x22B-instruct-v0.1 stands out with significantly higher counts compared to other models.
* Smaller models (e.g., Llama-2-3.2-1B-instruct) have the lowest counts for both good and bad answers.
* The ratio of good to bad answers appears relatively consistent across most models, although larger models tend to have a higher absolute number of both.
### Interpretation
The chart demonstrates the performance of different language models in generating answers, categorized as either "good" or "bad." The data suggests a positive correlation between model size and the absolute number of answers generated (both good and bad). Larger models, like Mixtral-8x22B-instruct-v0.1 and Qwen2.5-32B-instruct, are capable of producing a greater volume of responses. However, it's important to note that a higher count doesn't necessarily equate to better quality; the proportion of good answers relative to bad answers should also be considered. The consistent presence of "bad answers" across all models highlights the ongoing challenges in achieving perfect accuracy and reliability in language model outputs. The specific criteria used to define "good" and "bad" answers are not provided, which limits a deeper analysis of the results. Further investigation into the evaluation methodology would be necessary to understand the nuances of the performance differences between models.