TECHNICAL ASSET FINGERPRINT
38aca6f51f7c7b7dfc474c8d
Click to view fullscreen
Press ESC or click to close
FOUND IN PAPERS
EXPERT: healer-alpha-free VERSION 1
RUNTIME: free/openrouter/healer-alpha
INTEL_VERIFIED
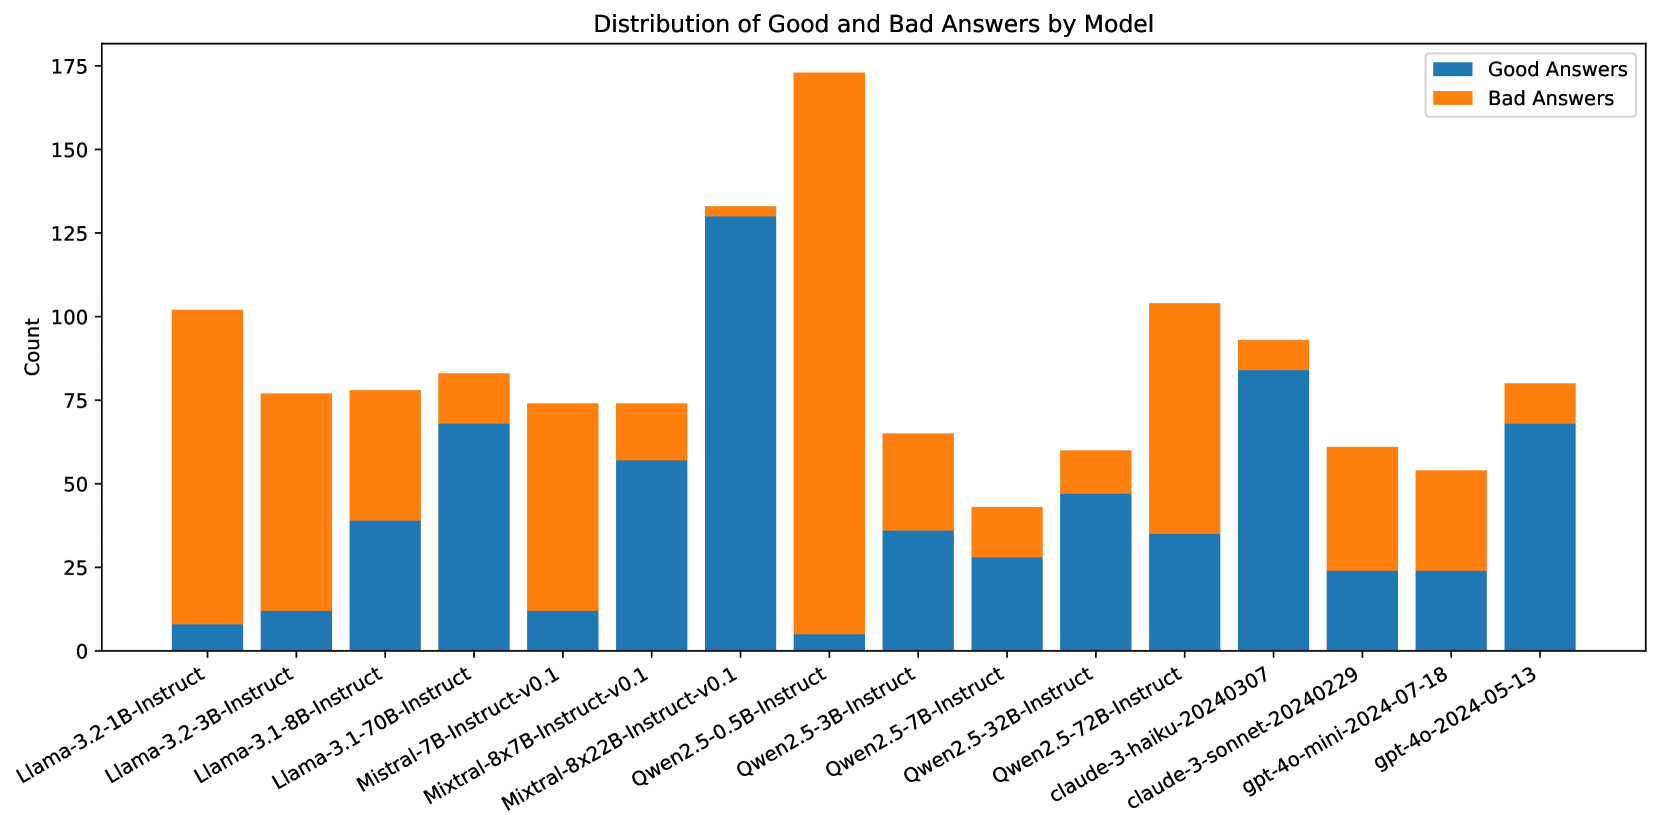
## Stacked Bar Chart: Distribution of Good and Bad Answers by Model
### Overview
This is a stacked bar chart comparing the performance of 15 different large language models (LLMs) on a task, measured by the count of "Good Answers" and "Bad Answers" each model produced. The chart visualizes both the total volume of responses and the quality distribution for each model.
### Components/Axes
* **Chart Title:** "Distribution of Good and Bad Answers by Model"
* **Y-Axis:** Labeled "Count". The scale runs from 0 to 175, with major gridlines at intervals of 25 (0, 25, 50, 75, 100, 125, 150, 175).
* **X-Axis:** Lists 15 distinct model names. The labels are rotated approximately 45 degrees for readability.
* **Legend:** Located in the top-right corner of the chart area.
* Blue square: "Good Answers"
* Orange square: "Bad Answers"
* **Data Series:** Each model has a single vertical bar composed of two stacked segments: a blue segment at the bottom (Good Answers) and an orange segment on top (Bad Answers). The total height of the bar represents the total number of answers recorded for that model.
### Detailed Analysis
Below is an analysis of each model's bar, from left to right. Values are approximate visual estimates from the chart.
1. **Llama-3.2-1B-Instruct**
* **Trend:** Very small blue base, very large orange top.
* **Good Answers (Blue):** ~8
* **Bad Answers (Orange):** ~94
* **Total Count:** ~102
2. **Llama-3.2-3B-Instruct**
* **Trend:** Small blue base, large orange top.
* **Good Answers (Blue):** ~12
* **Bad Answers (Orange):** ~65
* **Total Count:** ~77
3. **Llama-3.1-8B-Instruct**
* **Trend:** Moderate blue base, moderate orange top.
* **Good Answers (Blue):** ~39
* **Bad Answers (Orange):** ~39
* **Total Count:** ~78
4. **Llama-3.1-70B-Instruct**
* **Trend:** Large blue base, small orange top.
* **Good Answers (Blue):** ~68
* **Bad Answers (Orange):** ~15
* **Total Count:** ~83
5. **Mistral-7B-Instruct-v0.1**
* **Trend:** Small blue base, large orange top.
* **Good Answers (Blue):** ~12
* **Bad Answers (Orange):** ~62
* **Total Count:** ~74
6. **Mixtral-8x7B-Instruct-v0.1**
* **Trend:** Moderate blue base, moderate orange top.
* **Good Answers (Blue):** ~57
* **Bad Answers (Orange):** ~17
* **Total Count:** ~74
7. **Mixtral-8x22B-Instruct-v0.1**
* **Trend:** Very large blue base, very small orange top. This bar has the highest blue segment.
* **Good Answers (Blue):** ~130
* **Bad Answers (Orange):** ~4
* **Total Count:** ~134
8. **Qwen2.5-0.5B-Instruct**
* **Trend:** Extremely small blue base, extremely large orange top. This bar has the highest orange segment and the highest total count.
* **Good Answers (Blue):** ~5
* **Bad Answers (Orange):** ~169
* **Total Count:** ~174
9. **Qwen2.5-3B-Instruct**
* **Trend:** Moderate blue base, moderate orange top.
* **Good Answers (Blue):** ~36
* **Bad Answers (Orange):** ~30
* **Total Count:** ~66
10. **Qwen2.5-7B-Instruct**
* **Trend:** Moderate blue base, small orange top.
* **Good Answers (Blue):** ~28
* **Bad Answers (Orange):** ~15
* **Total Count:** ~43
11. **Qwen2.5-32B-Instruct**
* **Trend:** Moderate blue base, small orange top.
* **Good Answers (Blue):** ~47
* **Bad Answers (Orange):** ~12
* **Total Count:** ~59
12. **Qwen2.5-72B-Instruct**
* **Trend:** Moderate blue base, large orange top.
* **Good Answers (Blue):** ~35
* **Bad Answers (Orange):** ~69
* **Total Count:** ~104
13. **claude-3-haiku-20240307**
* **Trend:** Large blue base, small orange top.
* **Good Answers (Blue):** ~84
* **Bad Answers (Orange):** ~8
* **Total Count:** ~92
14. **claude-3-sonnet-20240229**
* **Trend:** Small blue base, moderate orange top.
* **Good Answers (Blue):** ~24
* **Bad Answers (Orange):** ~37
* **Total Count:** ~61
15. **gpt-4o-mini-2024-07-18**
* **Trend:** Small blue base, moderate orange top.
* **Good Answers (Blue):** ~24
* **Bad Answers (Orange):** ~30
* **Total Count:** ~54
16. **gpt-4o-2024-05-13**
* **Trend:** Large blue base, small orange top.
* **Good Answers (Blue):** ~68
* **Bad Answers (Orange):** ~12
* **Total Count:** ~80
### Key Observations
* **Extreme Outliers:** `Qwen2.5-0.5B-Instruct` is a significant outlier with the highest total count (~174) and the worst performance ratio, producing almost exclusively "Bad Answers." Conversely, `Mixtral-8x22B-Instruct-v0.1` has the highest count of "Good Answers" (~130) and a very low "Bad Answers" count.
* **Performance Spectrum:** There is a wide variation in the Good-to-Bad answer ratio across models. Some models (e.g., `Mixtral-8x22B`, `claude-3-haiku`, `Llama-3.1-70B`) show a strong majority of good answers, while others (e.g., `Qwen2.5-0.5B`, `Llama-3.2-1B`, `Mistral-7B`) show a strong majority of bad answers.
* **Total Volume Variation:** The total number of answers recorded per model varies significantly, from a low of ~43 (`Qwen2.5-7B-Instruct`) to a high of ~174 (`Qwen2.5-0.5B-Instruct`). This suggests the evaluation may not have been uniform across all models.
* **Model Family Trends:** Within the Qwen2.5 series, performance (good answer ratio) appears to improve with model size (0.5B -> 3B -> 7B -> 32B), though the 72B model breaks this trend with a higher bad answer count. The Llama-3.1 series also shows improved performance with increased size (8B -> 70B).
### Interpretation
This chart provides a comparative snapshot of model reliability on a specific, unspecified task. The data suggests that model size is not a perfect predictor of performance, as seen with the Qwen2.5-72B model's dip in quality compared to its 32B counterpart. The stark contrast between models like `Mixtral-8x22B` (high quality) and `Qwen2.5-0.5B` (low quality) highlights significant differences in capability or alignment for this particular evaluation.
The variation in total answer counts is a critical confounding factor. It raises questions about the evaluation methodology: Were models tested on the same number of prompts? Did some models fail to generate answers more often? Without this context, comparing raw counts is limited. A more meaningful metric would be the *percentage* of good answers, which normalizes for total volume. For example, `Mixtral-8x22B` has a ~97% good answer rate (130/134), while `Qwen2.5-0.5B` has a ~3% good answer rate (5/174).
The chart effectively communicates that for this task, certain models (notably the larger Mixtral, Claude, and Llama-3.1 variants) are far more trustworthy than others. The Peircean insight here is that the chart doesn't just show "good vs. bad"; it reveals a **gradient of reliability**. The "bad answers" are not merely failures but potential indicators of specific failure modes, biases, or limitations in the models' training or the task's design. An investigator would use this chart to shortlist high-performing models for deployment and flag low-performing ones for deeper error analysis to understand *why* they fail.
DECODING INTELLIGENCE...