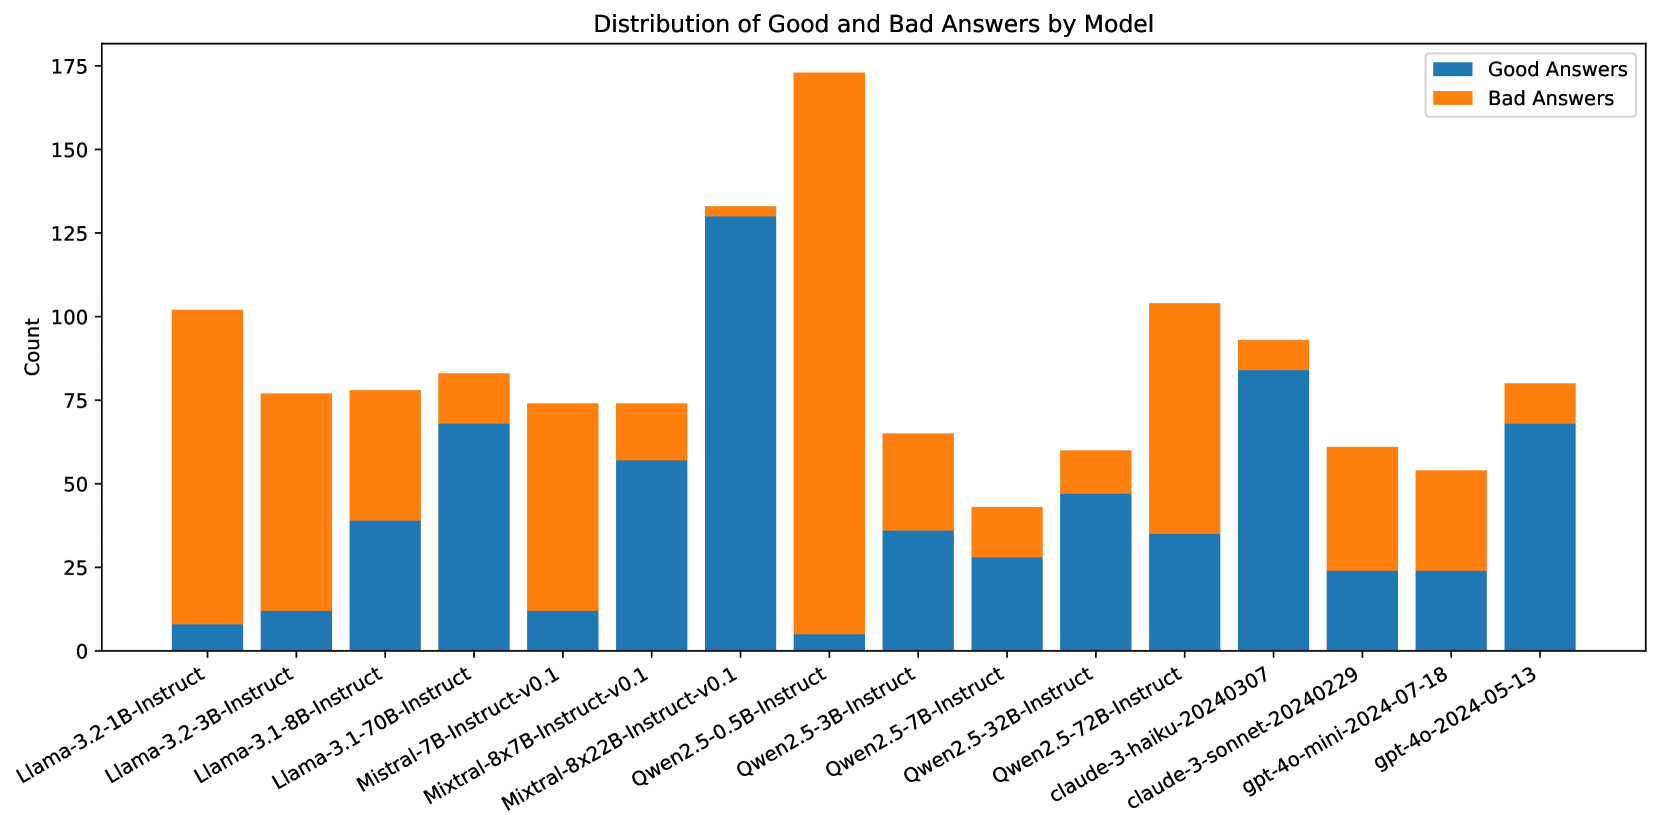
## Bar Chart: Distribution of Good and Bad Answers by Model
### Overview
The chart visualizes the distribution of "Good Answers" (blue) and "Bad Answers" (orange) across 15 AI models. Each model has two stacked bars showing counts for good and bad responses. The y-axis ranges from 0 to 175, with approximate values extracted from bar heights.
### Components/Axes
- **X-axis**: Model names (e.g., Llama-3.2-1B-Instruct, GPT-4)
- **Y-axis**: Count (0–175)
- **Legend**:
- Blue = Good Answers
- Orange = Bad Answers
- **Placement**: Legend in top-right corner; x-axis labels centered below bars; y-axis on left.
### Detailed Analysis
1. **Llama-3.2-1B-Instruct**:
- Good: ~10 (blue)
- Bad: ~90 (orange)
2. **Llama-3.2-3B-Instruct**:
- Good: ~12
- Bad: ~63
3. **Llama-3.1-8B-Instruct**:
- Good: ~38
- Bad: ~37
4. **Llama-3.1-70B-Instruct**:
- Good: ~68
- Bad: ~12
5. **Mistral-7B-Instruct-v0.1**:
- Good: ~12
- Bad: ~63
6. **Mistral-8x7B-Instruct-v0.1**:
- Good: ~55
- Bad: ~20
7. **Mistral-8x22B-Instruct-v0.1**:
- Good: ~130
- Bad: ~5
8. **Qwen2.5-0.5B-Instruct**:
- Good: ~5
- Bad: ~170
9. **Qwen2.5-7B-Instruct**:
- Good: ~35
- Bad: ~30
10. **Qwen2.5-32B-Instruct**:
- Good: ~25
- Bad: ~15
11. **Qwen2.5-72B-Instruct**:
- Good: ~30
- Bad: ~75
12. **Claude-3-haiku-20240307**:
- Good: ~85
- Bad: ~10
13. **Claude-3-sonnet-20240229**:
- Good: ~25
- Bad: ~40
14. **Claude-3-mini-2024-07-18**:
- Good: ~25
- Bad: ~30
15. **GPT-4o-mini-2024-05-13**:
- Good: ~70
- Bad: ~10
### Key Observations
- **Highest Total Count**: Qwen2.5-0.5B-Instruct (175 total answers, 95% bad).
- **Best Performance**: Claude-3-haiku-20240307 (85 good, 10 bad).
- **GPT-4o-mini**: Highest good-to-bad ratio (7:1).
- **Mistral-8x22B**: Mostly good answers (130 good, 5 bad).
- **Qwen2.5-0.5B**: Worst performance (95% bad answers).
### Interpretation
The data suggests significant variability in model performance. Larger models like Mistral-8x22B and Claude-3-haiku achieve high accuracy, while smaller models (e.g., Qwen2.5-0.5B) struggle with quality. GPT-4o-mini demonstrates the most balanced performance, with a strong emphasis on good answers. The chart highlights the trade-off between model size and reliability, with some large models (e.g., Qwen2.5-0.5B) producing many low-quality responses despite high output volume.