## Line Graphs: Average Return and Gradient Steps
### Overview
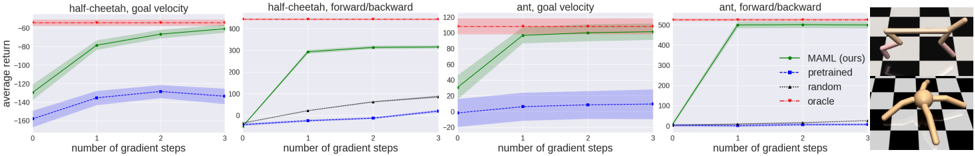
The image displays four line graphs, each representing different aspects of a machine learning experiment. The graphs are labeled as "half-cheetah, goal velocity," "half-cheetah, forward/backward," "ant, goal velocity," and "ant, forward/backward." Each graph shows the average return over a series of gradient steps, with the x-axis representing the number of gradient steps and the y-axis representing the average return.
### Components/Axes
- **X-axis**: Number of gradient steps
- **Y-axis**: Average return
- **Legend**: The legend on the right side of the graphs indicates the different methods used: "MAML (ours)," "pretrained," "random," and "oracle."
- **Data Points**: Each data point represents the average return for a specific method at a given number of gradient steps.
### Detailed Analysis or ### Content Details
- **Half-Cheetah, Goal Velocity**: The graph shows that the average return increases with the number of gradient steps for all methods, with "MAML (ours)" having the highest average return.
- **Half-Cheetah, Forward/Backward**: Similar to the first graph, the average return increases with the number of gradient steps, with "MAML (ours)" again having the highest average return.
- **Ant, Goal Velocity**: The graph shows a more gradual increase in average return with the number of gradient steps, with "MAML (ours)" having the highest average return.
- **Ant, Forward/Backward**: The graph shows a more gradual increase in average return with the number of gradient steps, with "MAML (ours)" again having the highest average return.
### Key Observations
- **MAML (ours)**: consistently shows the highest average return across all methods and graphs.
- **Pretrained**: shows a moderate average return, slightly lower than "MAML (ours)" but higher than "random" and "oracle."
- **Random**: shows the lowest average return across all methods and graphs.
- **Oracle**: shows the highest average return for the "half-cheetah, goal velocity" and "ant, goal velocity" graphs, but the lowest average return for the "half-cheetah, forward/backward" and "ant, forward/backward" graphs.
### Interpretation
The data suggests that the "MAML (ours)" method is more effective in achieving higher average returns compared to the other methods across all scenarios. The "pretrained" method shows a moderate performance, while the "random" and "oracle" methods show the lowest performance. The "half-cheetah, goal velocity" and "ant, goal velocity" graphs show a more consistent increase in average return with the number of gradient steps, while the "half-cheetah, forward/backward" and "ant, forward/backward" graphs show a more gradual increase. The "oracle" method shows the highest average return for the "half-cheetah, goal velocity" and "ant, goal velocity" graphs, but the lowest average return for the "half-cheetah, forward/backward" and "ant, forward/backward" graphs.