\n
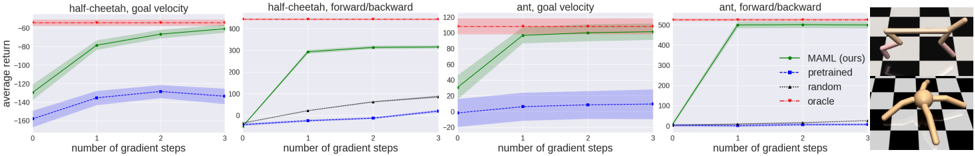
## Line Charts: Performance of Reinforcement Learning Algorithms
### Overview
The image presents four line charts, each depicting the average return of different reinforcement learning algorithms as a function of the number of gradient steps. The charts compare the performance of "MAML (ours)" against "pretrained", "random", and "oracle" algorithms across four different environments: half-cheetah goal velocity, half-cheetah toward/backward, ant goal velocity, and ant forward/backward. The final chart for "ant forward/backward" also includes a visual representation of the environment.
### Components/Axes
Each chart shares the following components:
* **X-axis:** "number of gradient steps" ranging from 0 to 3.
* **Y-axis:** "average return" with varying scales depending on the environment.
* half-cheetah goal velocity: approximately -200 to 50
* half-cheetah toward/backward: approximately -50 to 120
* ant goal velocity: approximately -20 to 120
* ant forward/backward: approximately -100 to 550
* **Legend:** Located in the top-right corner of each chart, identifying the data series:
* Green solid line: "MAML (ours)"
* Blue dashed line: "pretrained"
* Gray dashed-dotted line: "random"
* Red dashed line: "oracle"
Each chart also has a title indicating the environment being tested. The final chart includes an image of the ant robot in the environment.
### Detailed Analysis or Content Details
**1. half-cheetah goal velocity:**
* **MAML (ours):** Line slopes upward, starting at approximately 0 at 0 gradient steps, reaching approximately 40 at 3 gradient steps.
* **pretrained:** Line starts at approximately -150 at 0 gradient steps, increases to approximately 100 at 3 gradient steps.
* **random:** Line starts at approximately -180 at 0 gradient steps, increases to approximately 80 at 3 gradient steps.
* **oracle:** Horizontal dashed line at approximately 40 across all gradient steps.
**2. half-cheetah toward/backward:**
* **MAML (ours):** Line slopes upward, starting at approximately 0 at 0 gradient steps, reaching approximately 80 at 3 gradient steps.
* **pretrained:** Line starts at approximately -30 at 0 gradient steps, increases to approximately 60 at 3 gradient steps.
* **random:** Line starts at approximately -20 at 0 gradient steps, increases to approximately 40 at 3 gradient steps.
* **oracle:** Horizontal dashed line at approximately 100 across all gradient steps.
**3. ant goal velocity:**
* **MAML (ours):** Line slopes upward, starting at approximately 50 at 0 gradient steps, reaching approximately 100 at 3 gradient steps.
* **pretrained:** Line starts at approximately 0 at 0 gradient steps, increases to approximately 40 at 3 gradient steps.
* **random:** Line starts at approximately 0 at 0 gradient steps, increases to approximately 20 at 3 gradient steps.
* **oracle:** Horizontal dashed line at approximately 100 across all gradient steps.
**4. ant forward/backward:**
* **MAML (ours):** Line slopes upward sharply, starting at approximately -100 at 0 gradient steps, reaching approximately 500 at 3 gradient steps.
* **pretrained:** Line starts at approximately -100 at 0 gradient steps, increases to approximately 100 at 3 gradient steps.
* **random:** Line starts at approximately -100 at 0 gradient steps, increases to approximately 100 at 3 gradient steps.
* **oracle:** Horizontal dashed line at approximately 550 across all gradient steps.
### Key Observations
* "MAML (ours)" consistently outperforms "pretrained" and "random" in all environments, especially in the "ant forward/backward" environment.
* "oracle" provides the highest performance in all environments, serving as an upper bound.
* "pretrained" and "random" show similar performance across most environments.
* The scale of the Y-axis varies significantly between environments, indicating different reward structures.
### Interpretation
The data suggests that the "MAML (ours)" algorithm is effective at learning and adapting to different reinforcement learning environments with a relatively small number of gradient steps. The algorithm's performance approaches the "oracle" performance, indicating its potential for achieving optimal results. The consistent outperformance of "MAML (ours)" compared to "pretrained" and "random" suggests that the meta-learning approach employed by MAML is beneficial for rapid adaptation. The large difference in Y-axis scales highlights the varying difficulty of the different environments. The "ant forward/backward" environment appears to be the most challenging, as evidenced by the wider range of average returns and the higher "oracle" performance. The image of the ant robot in the "ant forward/backward" environment provides context for the task, showing a robot navigating a grid-like environment. The visual representation helps to understand the complexity of the environment and the challenges faced by the reinforcement learning algorithms.