## Line Charts with 3D Renderings: Meta-Learning Performance Comparison
### Overview
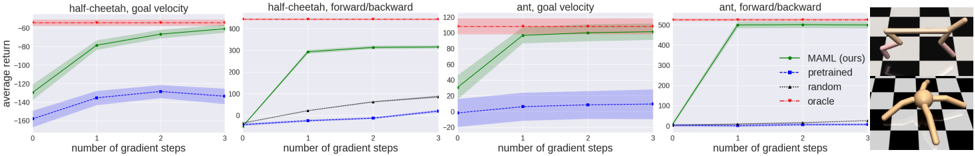
The image is a composite figure containing four line charts arranged horizontally, followed by two 3D robot renderings on the far right. The charts compare the performance of different learning methods on reinforcement learning tasks involving simulated robots ("half-cheetah" and "ant"). The overall theme is evaluating a meta-learning algorithm ("MAML") against baselines.
### Components/Axes
**Common Elements Across All Four Charts:**
* **X-axis:** Labeled "number of gradient steps". Ticks are at 0, 1, 2, and 3.
* **Y-axis:** Labeled "average return". The scale varies per chart.
* **Legend:** Located in the top-right corner of the fourth chart. It defines four data series:
* **MAML (ours):** Solid green line with circular markers.
* **pretrained:** Dashed blue line with square markers.
* **random:** Dotted gray line with triangular markers.
* **oracle:** Dashed red line with diamond markers. This appears as a horizontal shaded band, representing a performance ceiling or target.
**Individual Chart Titles (from left to right):**
1. `half-cheetah, goal velocity`
2. `half-cheetah, forward/backward`
3. `ant, goal velocity`
4. `ant, forward/backward`
**3D Renderings (Far Right):**
* **Top:** A 3D model of a "half-cheetah" robot (a two-legged, segmented robot) on a black-and-white checkered floor. It is in a running pose.
* **Bottom:** A 3D model of an "ant" robot (a four-legged, spider-like robot) on the same checkered floor. It is in a standing/walking pose.
### Detailed Analysis
**Chart 1: half-cheetah, goal velocity**
* **Y-axis Range:** Approximately -160 to -40.
* **Trends & Approximate Values:**
* **MAML (green):** Starts at ~-130 (step 0). Sharp increase to ~-70 (step 1). Gradual increase to ~-60 (step 2) and ~-55 (step 3). Shaded green region indicates variance.
* **pretrained (blue):** Starts at ~-150 (step 0). Increases to ~-130 (step 1). Plateaus around -130 to -125 for steps 2 and 3. Shaded blue region indicates variance.
* **random (gray):** Remains nearly flat at the bottom, around -155 to -150 across all steps.
* **oracle (red):** Horizontal band centered around -45, spanning roughly -50 to -40.
**Chart 2: half-cheetah, forward/backward**
* **Y-axis Range:** 0 to 300.
* **Trends & Approximate Values:**
* **MAML (green):** Starts at 0 (step 0). Very sharp increase to ~250 (step 1). Slight increase to ~260 (step 2) and ~270 (step 3).
* **pretrained (blue):** Starts at 0. Very slow, linear increase to ~20 (step 3).
* **random (gray):** Starts at 0. Linear increase to ~80 (step 3).
* **oracle (red):** Horizontal band centered around 290, spanning roughly 280 to 300.
**Chart 3: ant, goal velocity**
* **Y-axis Range:** -20 to 120.
* **Trends & Approximate Values:**
* **MAML (green):** Starts at ~20 (step 0). Sharp increase to ~90 (step 1). Plateaus near ~95 for steps 2 and 3.
* **pretrained (blue):** Starts at ~0. Very slow increase to ~10 (step 3). Shaded blue region indicates variance.
* **random (gray):** Starts at ~0. Linear increase to ~40 (step 3).
* **oracle (red):** Horizontal band centered around 110, spanning roughly 100 to 120.
**Chart 4: ant, forward/backward**
* **Y-axis Range:** 0 to 500.
* **Trends & Approximate Values:**
* **MAML (green):** Starts at 0 (step 0). Extremely sharp increase to ~450 (step 1). Plateaus near ~460 for steps 2 and 3.
* **pretrained (blue):** Remains flat at 0 across all steps.
* **random (gray):** Starts at 0. Linear increase to ~100 (step 3).
* **oracle (red):** Horizontal band centered around 490, spanning roughly 480 to 500.
### Key Observations
1. **Dominant Performance:** The "MAML (ours)" method (green line) consistently and dramatically outperforms the "pretrained" and "random" baselines across all four tasks after just one gradient step.
2. **Rapid Convergence:** MAML shows a steep performance jump between 0 and 1 gradient step, after which it plateaus or improves only marginally. This suggests rapid adaptation.
3. **Baseline Comparison:** The "pretrained" method (blue) performs poorly, often only slightly better than "random" (gray). In the "ant, forward/backward" task, it shows no learning at all.
4. **Oracle Gap:** While MAML approaches the "oracle" performance (red band), a consistent gap remains in all tasks, indicating room for improvement to reach the theoretical or expert ceiling.
5. **Task Difficulty:** The "forward/backward" tasks (charts 2 & 4) show a larger absolute performance gap between MAML and the baselines compared to the "goal velocity" tasks (charts 1 & 3).
### Interpretation
This figure presents strong empirical evidence for the effectiveness of the MAML (Model-Agnostic Meta-Learning) algorithm in few-shot reinforcement learning scenarios. The data demonstrates that MAML enables an agent to adapt to new tasks (different robot control objectives) with remarkable efficiency, achieving high performance with only a single gradient step of task-specific data.
The stark contrast between the green MAML line and the blue pretrained line highlights the core thesis: meta-learning for rapid adaptation is fundamentally more effective than simply using a fixed pretrained policy for these types of tasks. The "random" baseline provides a floor, showing the tasks are non-trivial.
The 3D renderings visually ground the abstract performance metrics, showing the physical systems (cheetah and ant robots) whose control policies are being evaluated. The checkered floor is a standard visual cue in physics simulation environments.
The persistent gap to the "oracle" suggests that while MAML is highly effective, the meta-learned initialization is not perfect. The oracle likely represents an upper bound achieved by training a separate policy from scratch for each task with abundant data, which MAML aims to approximate with minimal data. The charts effectively argue that MAML provides a strong balance between sample efficiency and final performance.