## Line Graphs: Performance Comparison Across Training Methods
### Overview
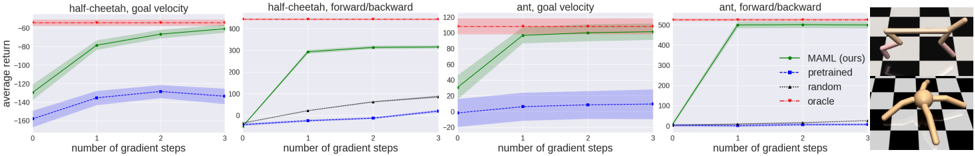
The image contains four line graphs comparing the performance of different training methods ("MAML (ours)," "pretrained," "random," and "oracle") across four robotic control tasks: "half-cheetah, goal velocity," "half-cheetah, forward/backward," "ant, goal velocity," and "ant, forward/backward." Each graph plots "average return" against "number of gradient steps" (0–3). The graphs include shaded confidence intervals and a legend for method identification. Two robotic diagrams (a quadruped and a spider-like robot) are positioned to the right of the graphs.
---
### Components/Axes
- **X-axis**: "number of gradient steps" (0, 1, 2, 3)
- **Y-axis**: "average return" (ranges vary by graph):
- Half-cheetah, goal velocity: -160 to -60
- Half-cheetah, forward/backward: 0 to 400
- Ant, goal velocity: -20 to 120
- Ant, forward/backward: 0 to 500
- **Legend**:
- Green: MAML (ours)
- Blue: pretrained
- Black: random
- Red: oracle
- **Diagrams**:
- Top-right: Quadruped robot (half-cheetah)
- Bottom-right: Spider-like robot (ant)
---
### Detailed Analysis
#### Half-Cheetah, Goal Velocity
- **MAML (green)**: Starts at ~-140 (step 0), improves to ~-60 (step 3).
- **Pretrained (blue)**: Starts at ~-160 (step 0), declines to ~-160 (step 3).
- **Random (black)**: Flat line at ~-160.
- **Oracle (red)**: Flat dashed line at ~-60.
#### Half-Cheetah, Forward/Backward
- **MAML (green)**: Starts at ~0 (step 0), rises to ~400 (step 3).
- **Pretrained (blue)**: Starts at ~0 (step 0), declines to ~-20 (step 3).
- **Random (black)**: Flat line at ~0.
- **Oracle (red)**: Flat dashed line at ~400.
#### Ant, Goal Velocity
- **MAML (green)**: Starts at ~-20 (step 0), rises to ~100 (step 3).
- **Pretrained (blue)**: Starts at ~-20 (step 0), declines to ~-20 (step 3).
- **Random (black)**: Flat line at ~-20.
- **Oracle (red)**: Flat dashed line at ~120.
#### Ant, Forward/Backward
- **MAML (green)**: Starts at ~0 (step 0), rises to ~500 (step 3).
- **Pretrained (blue)**: Starts at ~0 (step 0), declines to ~-20 (step 3).
- **Random (black)**: Flat line at ~0.
- **Oracle (red)**: Flat dashed line at ~500.
---
### Key Observations
1. **MAML (ours)** consistently improves performance across all tasks as gradient steps increase.
2. **Pretrained** methods degrade over time in all tasks except "half-cheetah, forward/backward," where it starts at 0 but declines.
3. **Random** methods show no improvement or degradation, remaining flat.
4. **Oracle** performance is task-specific and constant, representing the ideal benchmark.
5. Confidence intervals (shaded regions) are narrowest for MAML and widest for pretrained/random methods.
---
### Interpretation
- **MAML (ours)** demonstrates superior adaptability, closing the gap with the oracle over time. This suggests MAML’s meta-learning approach effectively leverages gradient steps to improve task performance.
- **Pretrained** methods underperform, possibly due to overfitting or lack of generalization across tasks.
- **Random** methods act as a baseline, showing no learning capability.
- The **oracle** lines highlight the theoretical maximum performance for each task, serving as a target for MAML.
- The robotic diagrams likely represent the physical embodiments of the "half-cheetah" (quadruped) and "ant" (spider-like) models tested in the experiments.
The data underscores MAML’s effectiveness in meta-learning for robotic control tasks, outperforming static pretrained and random baselines while approaching oracle-level performance.