## Bar Chart: Model Performance Comparison Across Precision Formats
### Overview
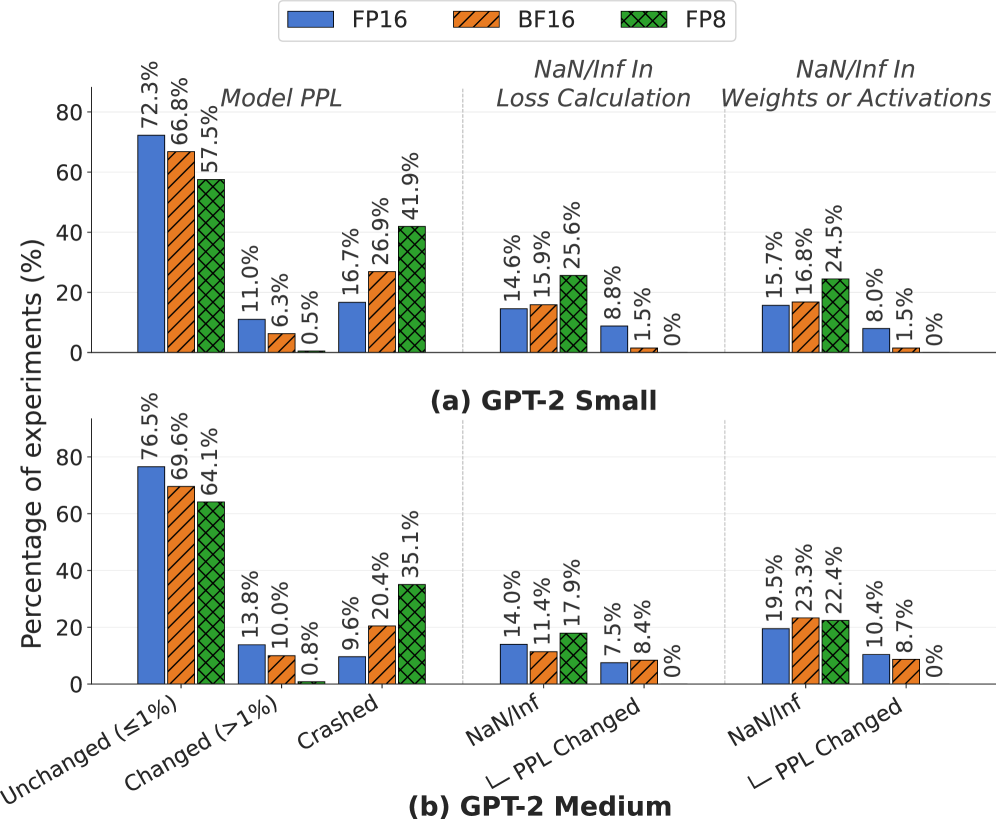
The chart compares the performance of GPT-2 Small and Medium models across three precision formats (FP16, BF16, FP8) using three metrics: Model PPL, NaN/Inf in Loss Calculation, and NaN/Inf in Weights or Activations. Data is presented as percentages of experiments across three categories: Unchanged (≤1%), Changed (>1%), and Crashed.
### Components/Axes
- **X-Axis**: Categories (Unchanged (≤1%), Changed (>1%), Crashed)
- **Y-Axis**: Percentage of experiments (%)
- **Legend**:
- FP16 (blue)
- BF16 (orange)
- FP8 (green)
- **Subsections**:
- (a) GPT-2 Small
- (b) GPT-2 Medium
### Detailed Analysis
#### (a) GPT-2 Small
1. **Model PPL**:
- **Unchanged (≤1%)**: FP16 (72.3%), BF16 (66.8%), FP8 (57.5%)
- **Changed (>1%)**: FP16 (11.0%), BF16 (6.3%), FP8 (0.5%)
- **Crashed**: FP16 (16.7%), BF16 (26.9%), FP8 (41.9%)
2. **NaN/Inf in Loss Calculation**:
- FP16 (14.6%), BF16 (15.9%), FP8 (25.6%)
3. **NaN/Inf in Weights or Activations**:
- FP16 (15.7%), BF16 (16.8%), FP8 (24.5%)
#### (b) GPT-2 Medium
1. **Model PPL**:
- **Unchanged (≤1%)**: FP16 (76.5%), BF16 (69.6%), FP8 (64.1%)
- **Changed (>1%)**: FP16 (13.8%), BF16 (10.0%), FP8 (0.8%)
- **Crashed**: FP16 (9.6%), BF16 (20.4%), FP8 (35.1%)
2. **NaN/Inf in Loss Calculation**:
- FP16 (14.0%), BF16 (11.4%), FP8 (17.9%)
3. **NaN/Inf in Weights or Activations**:
- FP16 (19.5%), BF16 (23.3%), FP8 (22.4%)
### Key Observations
1. **FP8 Consistently Higher Crash Rates**:
- In both models, FP8 has the highest percentages in the "Crashed" category (41.9% for Small, 35.1% for Medium), suggesting lower numerical stability.
2. **FP16 Dominates Unchanged States**:
- FP16 shows the highest percentages in "Unchanged (≤1%)" for both models (72.3% and 76.5%), indicating better stability in maintaining small changes.
3. **BF16 as a Middle Ground**:
- BF16 generally falls between FP16 and FP8 in all metrics, with moderate performance across categories.
4. **FP8 Higher NaN/Inf in Loss Calculation**:
- FP8 has the highest NaN/Inf rates in loss calculation (25.6% for Small, 17.9% for Medium), highlighting potential precision-related issues.
### Interpretation
The data suggests that **FP8 precision introduces greater numerical instability** compared to FP16 and BF16, as evidenced by higher crash rates and NaN/Inf occurrences. FP16 demonstrates superior stability in maintaining unchanged states but underperforms in crash resilience. BF16 balances performance but does not outperform FP16 in critical metrics. These trends imply that lower-precision formats (FP8) may require additional safeguards for reliable model execution, while FP16 remains the most stable choice for minimizing numerical errors.