## Flowchart: Reinforcement Learning Workflow with Rollout X Times
### Overview
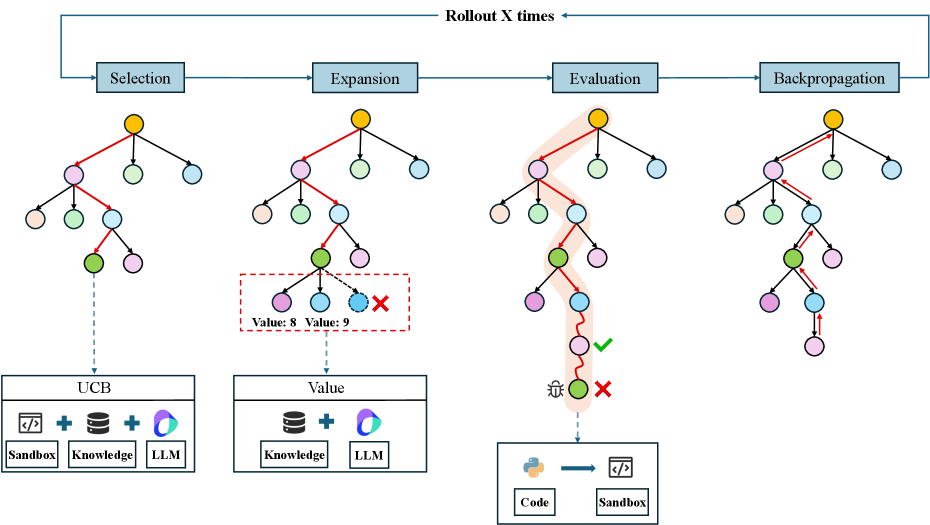
The image depicts a four-stage reinforcement learning workflow visualized as a flowchart. It illustrates the process of selecting, expanding, evaluating, and backpropagating decisions through iterative rollouts (X times). The diagram uses color-coded nodes, directional arrows, and annotations to represent decision trees, value assignments, and feedback mechanisms.
### Components/Axes
1. **Stages (Left to Right)**:
- **Selection**: Initial decision tree with nodes in pink, green, and blue.
- **Expansion**: Expanded tree with highlighted nodes (red dashed box) and value annotations ("Value: 8", "Value: 9").
- **Evaluation**: Path evaluation with checkmarks (✓) and X marks, showing correct/incorrect outcomes.
- **Backpropagation**: Adjusted tree with arrows indicating feedback corrections.
2. **Node Colors**:
- **Yellow**: Root nodes (top of each tree).
- **Pink**: Intermediate decision nodes.
- **Green**: Correct/positive outcomes.
- **Blue**: Neutral/negative outcomes.
- **Red**: Highlighted/selected paths (Expansion stage).
3. **Annotations**:
- "Rollout X times" (top arrow).
- "Value: 8" and "Value: 9" (Expansion stage, red box).
- "✓" (correct path) and "×" (incorrect path) (Evaluation stage).
- "Code → Sandbox" (Evaluation to Backpropagation arrow).
4. **Data Sources**:
- **UCIB**: Combines Sandbox, Knowledge, and LLM (Selection stage).
- **Value**: Combines Knowledge and LLM (Expansion stage).
- **Code**: Output from Evaluation stage.
- **Sandbox**: Input to Backpropagation stage.
### Detailed Analysis
- **Selection Stage**: A decision tree with 5 nodes (1 yellow root, 3 pink, 1 green). The green node connects to a "UCIB" box containing Sandbox, Knowledge, and LLM components.
- **Expansion Stage**: Tree expands to 7 nodes (1 yellow, 3 pink, 3 green). A red dashed box highlights 3 nodes with values 8 and 9, suggesting quantitative evaluation criteria.
- **Evaluation Stage**: Path evaluation shows 3 pink nodes leading to 2 green (✓) and 1 blue (×) nodes. A highlighted path (pink arrow) connects to "Code" and "Sandbox".
- **Backpropagation Stage**: Adjusted tree with 5 nodes (1 yellow, 2 pink, 2 green). Arrows indicate feedback corrections to specific nodes.
### Key Observations
1. **Iterative Process**: The "Rollout X times" label emphasizes repeated cycles through all stages.
2. **Value Assignment**: Values 8 and 9 in the Expansion stage likely represent heuristic scores for node selection.
3. **Feedback Mechanism**: The Evaluation stage's checkmarks/X marks directly influence Backpropagation adjustments.
4. **Color-Coded Logic**: Green nodes consistently represent positive outcomes across stages.
### Interpretation
This flowchart models a reinforcement learning pipeline where:
1. **Selection** identifies initial decision paths using combined data sources (UCIB).
2. **Expansion** quantitatively evaluates node potential (values 8/9) to prioritize exploration.
3. **Evaluation** tests paths in a sandboxed environment, marking successes (✓) and failures (×).
4. **Backpropagation** refines the decision tree based on evaluation feedback, creating a closed-loop optimization system.
The diagram highlights the importance of value-based node selection (Expansion stage) and the direct impact of evaluation outcomes on model refinement. The use of "X times" rollouts suggests this is part of a larger iterative training process common in reinforcement learning frameworks.