## Line Chart: Accuracy vs. Attack Ratio
### Overview
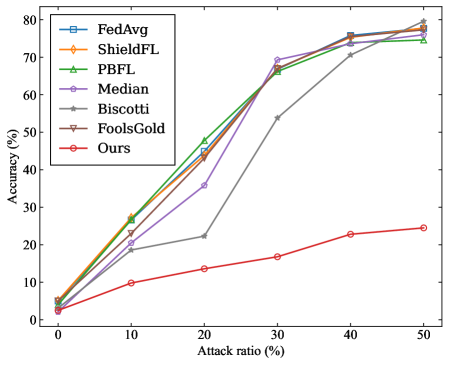
The image is a line chart comparing the accuracy of different federated learning algorithms against varying attack ratios. The chart displays how the accuracy of each algorithm changes as the attack ratio increases from 0% to 50%. The algorithms compared are FedAvg, ShieldFL, PBFL, Median, Biscotti, FoolsGold, and Ours.
### Components/Axes
* **X-axis:** Attack ratio (%), with markers at 0, 10, 20, 30, 40, and 50.
* **Y-axis:** Accuracy (%), ranging from 0 to 80, with markers every 10 units.
* **Legend (top-left):**
* Blue square: FedAvg
* Orange diamond: ShieldFL
* Green triangle: PBFL
* Purple circle: Median
* Gray star: Biscotti
* Brown inverted triangle: FoolsGold
* Red circle: Ours
### Detailed Analysis
* **FedAvg (Blue Square):** Starts at approximately 4% accuracy at 0% attack ratio. Increases sharply to approximately 47% at 20% attack ratio, then continues to increase, reaching approximately 74% at 50% attack ratio.
* **ShieldFL (Orange Diamond):** Starts at approximately 4% accuracy at 0% attack ratio. Increases sharply to approximately 48% at 20% attack ratio, then continues to increase, reaching approximately 77% at 50% attack ratio.
* **PBFL (Green Triangle):** Starts at approximately 4% accuracy at 0% attack ratio. Increases sharply to approximately 45% at 20% attack ratio, then continues to increase, reaching approximately 76% at 50% attack ratio.
* **Median (Purple Circle):** Starts at approximately 4% accuracy at 0% attack ratio. Increases to approximately 36% at 20% attack ratio, then continues to increase, reaching approximately 74% at 50% attack ratio.
* **Biscotti (Gray Star):** Starts at approximately 4% accuracy at 0% attack ratio. Increases to approximately 22% at 20% attack ratio, then increases sharply to approximately 68% at 30% attack ratio, then increases slightly to approximately 74% at 50% attack ratio.
* **FoolsGold (Brown Inverted Triangle):** Starts at approximately 4% accuracy at 0% attack ratio. Increases to approximately 24% at 10% attack ratio, then increases to approximately 44% at 20% attack ratio, then increases to approximately 67% at 30% attack ratio, then increases to approximately 74% at 40% attack ratio, then increases to approximately 78% at 50% attack ratio.
* **Ours (Red Circle):** Starts at approximately 3% accuracy at 0% attack ratio. Increases slowly to approximately 14% at 20% attack ratio, then continues to increase slowly, reaching approximately 24% at 50% attack ratio.
### Key Observations
* FedAvg, ShieldFL, PBFL, Median, Biscotti, and FoolsGold algorithms show similar performance trends, with accuracy increasing significantly as the attack ratio increases.
* The "Ours" algorithm consistently underperforms compared to the other algorithms across all attack ratios.
* Biscotti shows a notable jump in accuracy between 20% and 30% attack ratios.
### Interpretation
The chart suggests that FedAvg, ShieldFL, PBFL, Median, Biscotti, and FoolsGold are more resilient to attacks as the attack ratio increases, paradoxically improving in accuracy. This could indicate that these algorithms are adapting or benefiting from the adversarial conditions in some way. In contrast, the "Ours" algorithm appears to be significantly more vulnerable to attacks, as its accuracy remains low even at higher attack ratios. The jump in accuracy for Biscotti between 20% and 30% attack ratios could indicate a threshold where the algorithm becomes more effective at mitigating the effects of the attack. The data implies that the "Ours" algorithm needs further refinement to improve its robustness against adversarial attacks.