\n
## Line Chart: Federated Learning Accuracy vs. Attack Ratio
### Overview
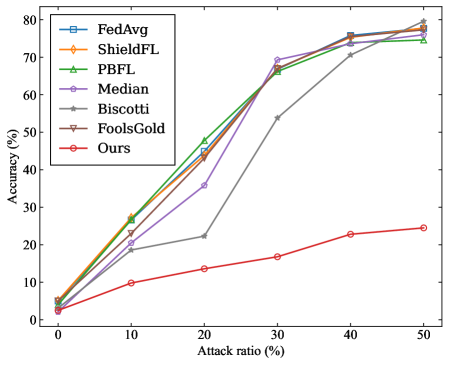
The image is a line chart comparing the performance (accuracy) of seven different federated learning methods or algorithms as the percentage of malicious participants (attack ratio) in the system increases. The chart demonstrates how each method's accuracy is affected by a rising proportion of adversarial attacks.
### Components/Axes
* **Chart Type:** Multi-series line chart with markers.
* **X-Axis (Horizontal):**
* **Label:** `Attack ratio (%)`
* **Scale:** Linear, from 0 to 50.
* **Major Tick Marks:** 0, 10, 20, 30, 40, 50.
* **Y-Axis (Vertical):**
* **Label:** `Accuracy (%)`
* **Scale:** Linear, from 0 to 80.
* **Major Tick Marks:** 0, 10, 20, 30, 40, 50, 60, 70, 80.
* **Legend:** Located in the top-left corner of the plot area. It lists seven data series with corresponding line colors and marker symbols.
1. `FedAvg` - Blue line with square markers (□).
2. `ShieldFL` - Orange line with diamond markers (◇).
3. `PBFL` - Green line with upward-pointing triangle markers (△).
4. `Median` - Purple line with circle markers (○).
5. `Biscotti` - Gray line with star/asterisk markers (☆).
6. `FoolsGold` - Brown line with downward-pointing triangle markers (▽).
7. `Ours` - Red line with circle markers (○).
### Detailed Analysis
**Data Series Trends and Approximate Values:**
1. **FedAvg (Blue, □):** Shows a strong, nearly linear upward trend. Starts at ~5% accuracy at 0% attack ratio. Increases steadily to ~25% at 10%, ~45% at 20%, ~68% at 30%, ~75% at 40%, and ends at ~78% at 50%.
2. **ShieldFL (Orange, ◇):** Follows a very similar trajectory to FedAvg. Starts at ~5% at 0%. Rises to ~27% at 10%, ~44% at 20%, ~66% at 30%, ~75% at 40%, and ~77% at 50%.
3. **PBFL (Green, △):** Also closely follows the top-performing group. Starts at ~5% at 0%. Increases to ~28% at 10%, ~48% at 20%, ~66% at 30%, ~74% at 40%, and ~75% at 50%.
4. **Median (Purple, ○):** Exhibits a non-monotonic trend. Starts at ~5% at 0%. Rises to ~22% at 10%, then dips to ~35% at 20%. Recovers sharply to ~69% at 30%, then continues to ~75% at 40% and ~76% at 50%.
5. **Biscotti (Gray, ☆):** Shows a delayed but steep increase. Starts at ~5% at 0%. Increases slowly to ~19% at 10% and ~22% at 20%. Then jumps dramatically to ~54% at 30%, followed by a steady rise to ~71% at 40% and ~75% at 50%.
6. **FoolsGold (Brown, ▽):** Tracks almost identically with FedAvg and ShieldFL. Starts at ~5% at 0%. Rises to ~26% at 10%, ~45% at 20%, ~67% at 30%, ~76% at 40%, and ~78% at 50%.
7. **Ours (Red, ○):** Demonstrates a significantly lower and more gradual upward trend compared to all other methods. Starts at ~3% at 0%. Increases slowly to ~10% at 10%, ~13% at 20%, ~17% at 30%, ~23% at 40%, and ends at ~24% at 50%.
### Key Observations
1. **Performance Clustering:** Six of the seven methods (FedAvg, ShieldFL, PBFL, Median, Biscotti, FoolsGold) converge to a high accuracy range of approximately 75-78% when the attack ratio reaches 50%.
2. **The "Ours" Outlier:** The method labeled "Ours" is a clear outlier, performing drastically worse than all other compared methods across the entire range of attack ratios. Its maximum accuracy (~24%) is less than one-third of the others' final accuracy.
3. **Non-Monotonic Behavior:** The `Median` method shows a notable dip in accuracy at the 20% attack ratio before recovering.
4. **Delayed Response:** The `Biscotti` method shows minimal improvement until the attack ratio exceeds 20%, after which it improves rapidly.
5. **Counter-Intuitive Trend:** For the top six methods, accuracy *increases* as the attack ratio increases. This is contrary to the expected behavior where more attacks would degrade performance.
### Interpretation
This chart likely comes from a research paper evaluating a new federated learning defense mechanism. The data suggests the following:
* **Robustness of Established Methods:** The six methods other than "Ours" appear to be robust defense strategies. Their increasing accuracy with higher attack ratios implies they might be designed to identify and mitigate malicious updates more effectively when attacks are more prevalent, or that the experimental setup has a specific characteristic that favors them under high attack conditions.
* **Purpose of "Ours":** The method labeled "Ours" is almost certainly the **baseline or the proposed vulnerable method** that the paper aims to improve upon. It represents the performance of a standard federated learning algorithm (like FedAvg) *without* any defense against poisoning attacks. Its poor and slowly rising performance shows it is highly susceptible to malicious participants.
* **Research Narrative:** The chart constructs a clear argument: "Standard federated learning ('Ours') fails under attack. However, these other existing defense methods (FedAvg with defense, ShieldFL, PBFL, etc.) are effective, maintaining high accuracy even when half the participants are malicious." The paper would then likely introduce a new method that either matches or exceeds the performance of these defenses, or addresses a limitation they have (like the dip seen in `Median` or the slow start of `Biscotti`).
* **Experimental Design:** The fact that accuracy increases with attack ratio for the defended methods is a critical point. It suggests the attack method used might be a simple one that becomes easier to detect and filter out when it is more common, or that the defense mechanisms are specifically tuned to be more aggressive at higher perceived threat levels.