## Line Graph: Accuracy vs. Attack Ratio (%)
### Overview
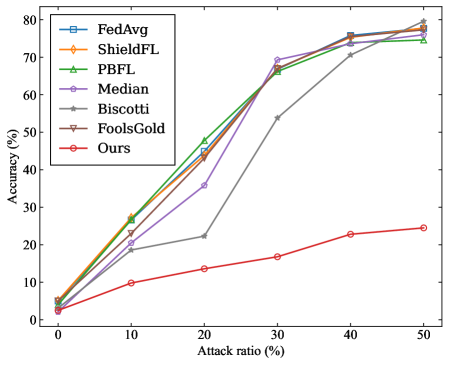
The image is a line graph comparing the accuracy of multiple methods (FedAvg, ShieldFL, PBFL, Median, Biscotti, FoolsGold, and "Ours") across varying attack ratios (0% to 50%). Accuracy is measured on the y-axis (0–80%), while the x-axis represents attack ratio percentages. The graph shows how each method's performance degrades or improves as adversarial attack intensity increases.
### Components/Axes
- **X-axis**: Attack ratio (%) ranging from 0 to 50% in 10% increments.
- **Y-axis**: Accuracy (%) ranging from 0 to 80% in 10% increments.
- **Legend**: Located in the top-right corner, associating colors and markers with methods:
- **FedAvg**: Blue squares
- **ShieldFL**: Orange diamonds
- **PBFL**: Green triangles
- **Median**: Purple pentagons
- **Biscotti**: Gray stars
- **FoolsGold**: Brown triangles
- **Ours**: Red circles
### Detailed Analysis
1. **FedAvg (Blue Squares)**:
- Starts at ~5% accuracy at 0% attack ratio.
- Peaks at ~75% accuracy at 30% attack ratio.
- Drops to ~70% at 50% attack ratio.
2. **ShieldFL (Orange Diamonds)**:
- Starts at ~5% accuracy at 0% attack ratio.
- Rises to ~75% at 30% attack ratio.
- Ends at ~78% at 50% attack ratio.
3. **PBFL (Green Triangles)**:
- Starts at ~5% accuracy at 0% attack ratio.
- Peaks at ~70% at 30% attack ratio.
- Ends at ~75% at 50% attack ratio.
4. **Median (Purple Pentagons)**:
- Starts at ~5% accuracy at 0% attack ratio.
- Rises to ~70% at 30% attack ratio.
- Ends at ~77% at 50% attack ratio.
5. **Biscotti (Gray Stars)**:
- Starts at ~5% accuracy at 0% attack ratio.
- Sharp rise to ~55% at 30% attack ratio.
- Ends at ~78% at 50% attack ratio.
6. **FoolsGold (Brown Triangles)**:
- Starts at ~5% accuracy at 0% attack ratio.
- Peaks at ~70% at 30% attack ratio.
- Ends at ~75% at 50% attack ratio.
7. **Ours (Red Circles)**:
- Starts at ~5% accuracy at 0% attack ratio.
- Gradual rise to ~25% at 30% attack ratio.
- Ends at ~25% at 50% attack ratio.
### Key Observations
- **Performance Trends**:
- Most methods (FedAvg, ShieldFL, PBFL, Median, FoolsGold) show a steep increase in accuracy up to 30% attack ratio, followed by a plateau or slight decline.
- **Biscotti** exhibits a unique sharp rise at 30% attack ratio, outperforming others at this point.
- **Ours** underperforms consistently, with minimal improvement beyond 0% attack ratio.
- **Outliers**:
- **Biscotti** and **ShieldFL** achieve the highest accuracy at 50% attack ratio (~78%).
- **Ours** remains the lowest-performing method across all attack ratios.
### Interpretation
The graph demonstrates that adversarial attack intensity (attack ratio) significantly impacts model accuracy. Most methods improve performance as attack ratio increases up to 30%, likely due to adaptive mechanisms or robustness training. However, beyond 30%, performance stabilizes or degrades slightly, suggesting a threshold for effective defense. **Biscotti** and **ShieldFL** show superior resilience at high attack ratios, while **Ours** lags behind, indicating potential limitations in its design or training strategy. The data implies that robustness to adversarial attacks depends on the method's ability to adapt to increasing perturbation levels, with some approaches (e.g., Biscotti) excelling in extreme conditions.