## Line Chart: Token Length and Pass Rate vs. RL Training Steps
### Overview
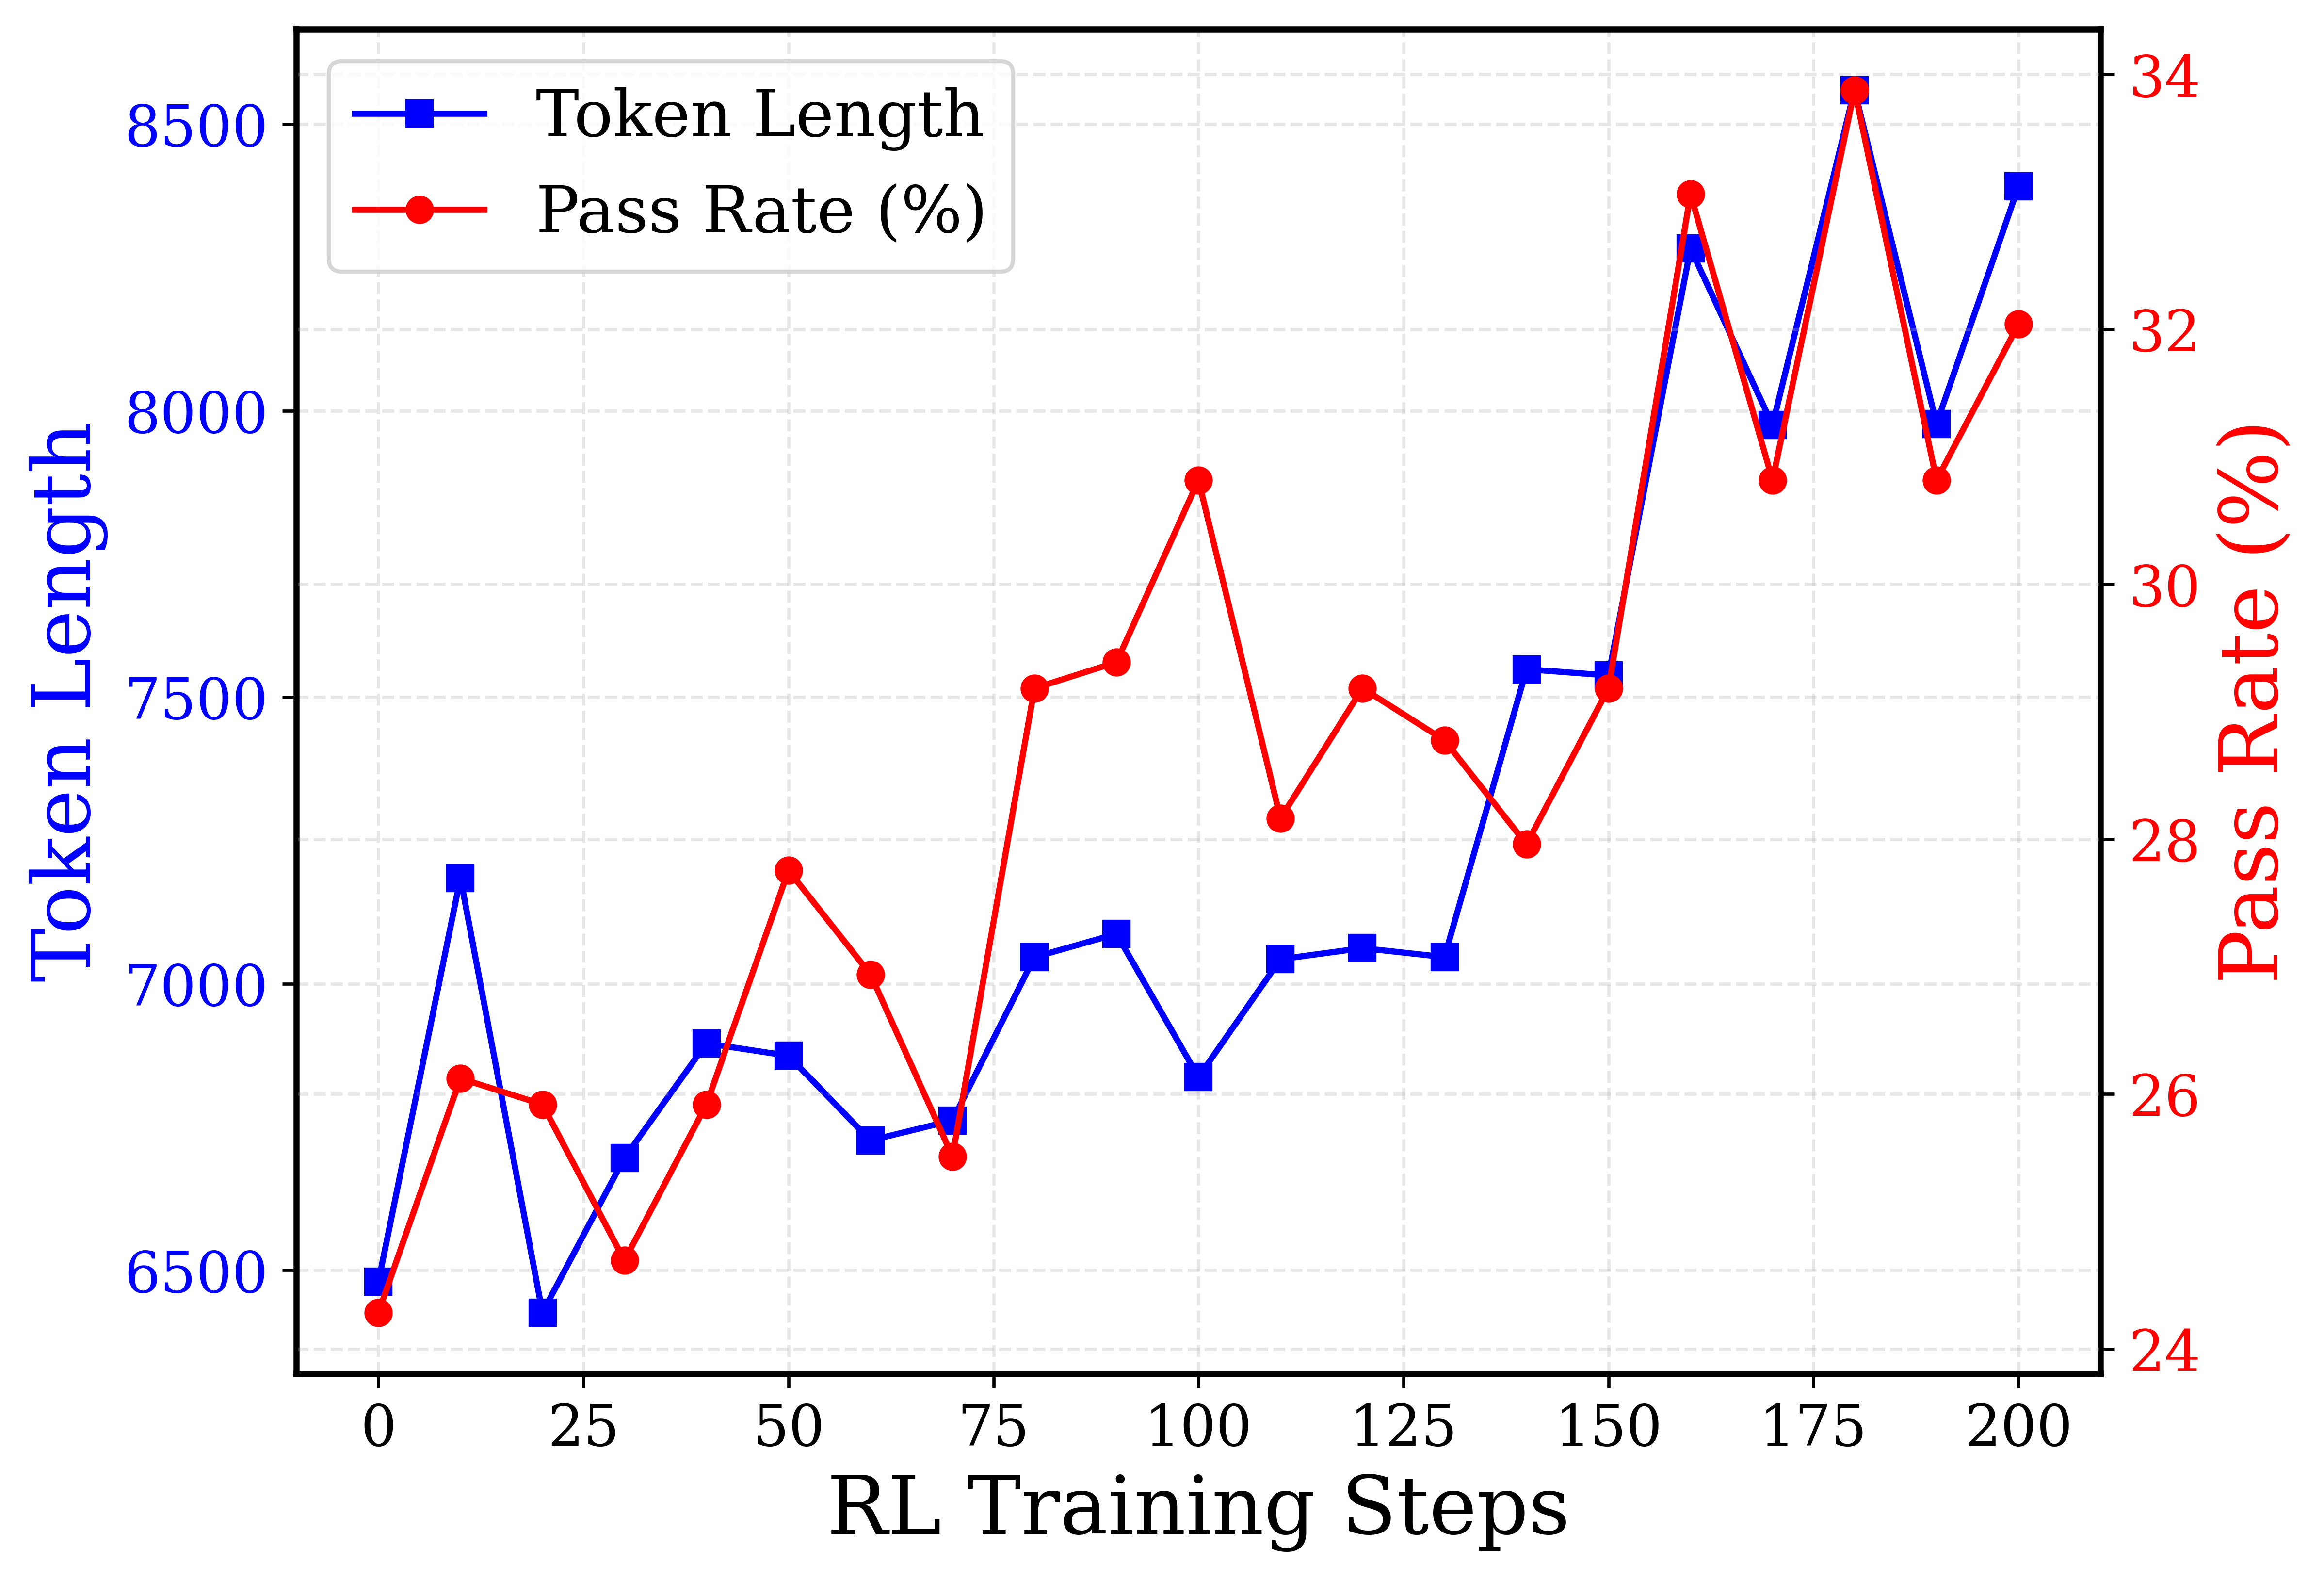
The image is a line chart comparing "Token Length" and "Pass Rate (%)" against "RL Training Steps." The chart uses two y-axes to represent the different scales of the two metrics. The x-axis represents the RL Training Steps.
### Components/Axes
* **X-axis:** "RL Training Steps" with markers at 0, 25, 50, 75, 100, 125, 150, 175, and 200.
* **Left Y-axis:** "Token Length" (blue) with a scale from 6500 to 8500, marked at 6500, 7000, 7500, 8000, and 8500.
* **Right Y-axis:** "Pass Rate (%)" (red) with a scale from 24 to 34, marked at 24, 26, 28, 30, 32, and 34.
* **Legend:** Located in the top-left corner, it identifies the blue line with square markers as "Token Length" and the red line with circle markers as "Pass Rate (%)".
### Detailed Analysis
* **Token Length (Blue Line):**
* The line starts at approximately 6500 at 0 RL Training Steps.
* It increases to approximately 7200 at 25 steps.
* It decreases to approximately 6400 at 37.5 steps.
* It increases to approximately 6900 at 50 steps.
* It decreases to approximately 6700 at 62.5 steps.
* It increases to approximately 7100 at 75 steps.
* It decreases to approximately 6800 at 100 steps.
* It increases to approximately 7050 at 112.5 steps.
* It remains at approximately 7050 at 125 steps.
* It increases to approximately 7550 at 150 steps.
* It decreases to approximately 7500 at 162.5 steps.
* It decreases to approximately 7000 at 175 steps.
* It increases to approximately 8400 at 200 steps.
* **Pass Rate (%) (Red Line):**
* The line starts at approximately 24.5% at 0 RL Training Steps.
* It increases to approximately 26.5% at 25 steps.
* It decreases to approximately 25% at 37.5 steps.
* It increases to approximately 27.5% at 50 steps.
* It decreases to approximately 26% at 62.5 steps.
* It increases to approximately 29% at 75 steps.
* It increases to approximately 31% at 100 steps.
* It decreases to approximately 28% at 112.5 steps.
* It increases to approximately 29% at 125 steps.
* It decreases to approximately 27% at 137.5 steps.
* It increases to approximately 29% at 150 steps.
* It increases to approximately 33% at 162.5 steps.
* It decreases to approximately 30% at 175 steps.
* It increases to approximately 34% at 187.5 steps.
* It decreases to approximately 32% at 200 steps.
### Key Observations
* Both "Token Length" and "Pass Rate (%)" exhibit fluctuations throughout the RL training steps.
* The "Pass Rate (%)" shows a general upward trend, especially after 150 RL Training Steps.
* The "Token Length" also shows an upward trend, especially after 150 RL Training Steps.
* There are some points where the trends of "Token Length" and "Pass Rate (%)" seem to correlate, but this is not consistent throughout the entire range.
### Interpretation
The chart illustrates the relationship between "Token Length" and "Pass Rate (%)" during RL training. The fluctuations suggest that the training process involves exploration and refinement. The upward trend in "Pass Rate (%)" indicates that the model is generally improving its performance as training progresses. The "Token Length" also increases, which could be related to the model generating more complex or detailed outputs as it learns. The correlation between the two metrics is not always consistent, suggesting that other factors may also influence the "Pass Rate (%)". The data suggests that continued training beyond 200 steps might lead to further improvements in "Pass Rate (%)", but it's important to monitor "Token Length" to ensure the model doesn't become overly complex or inefficient.