\n
## Line Chart: RL Training Performance
### Overview
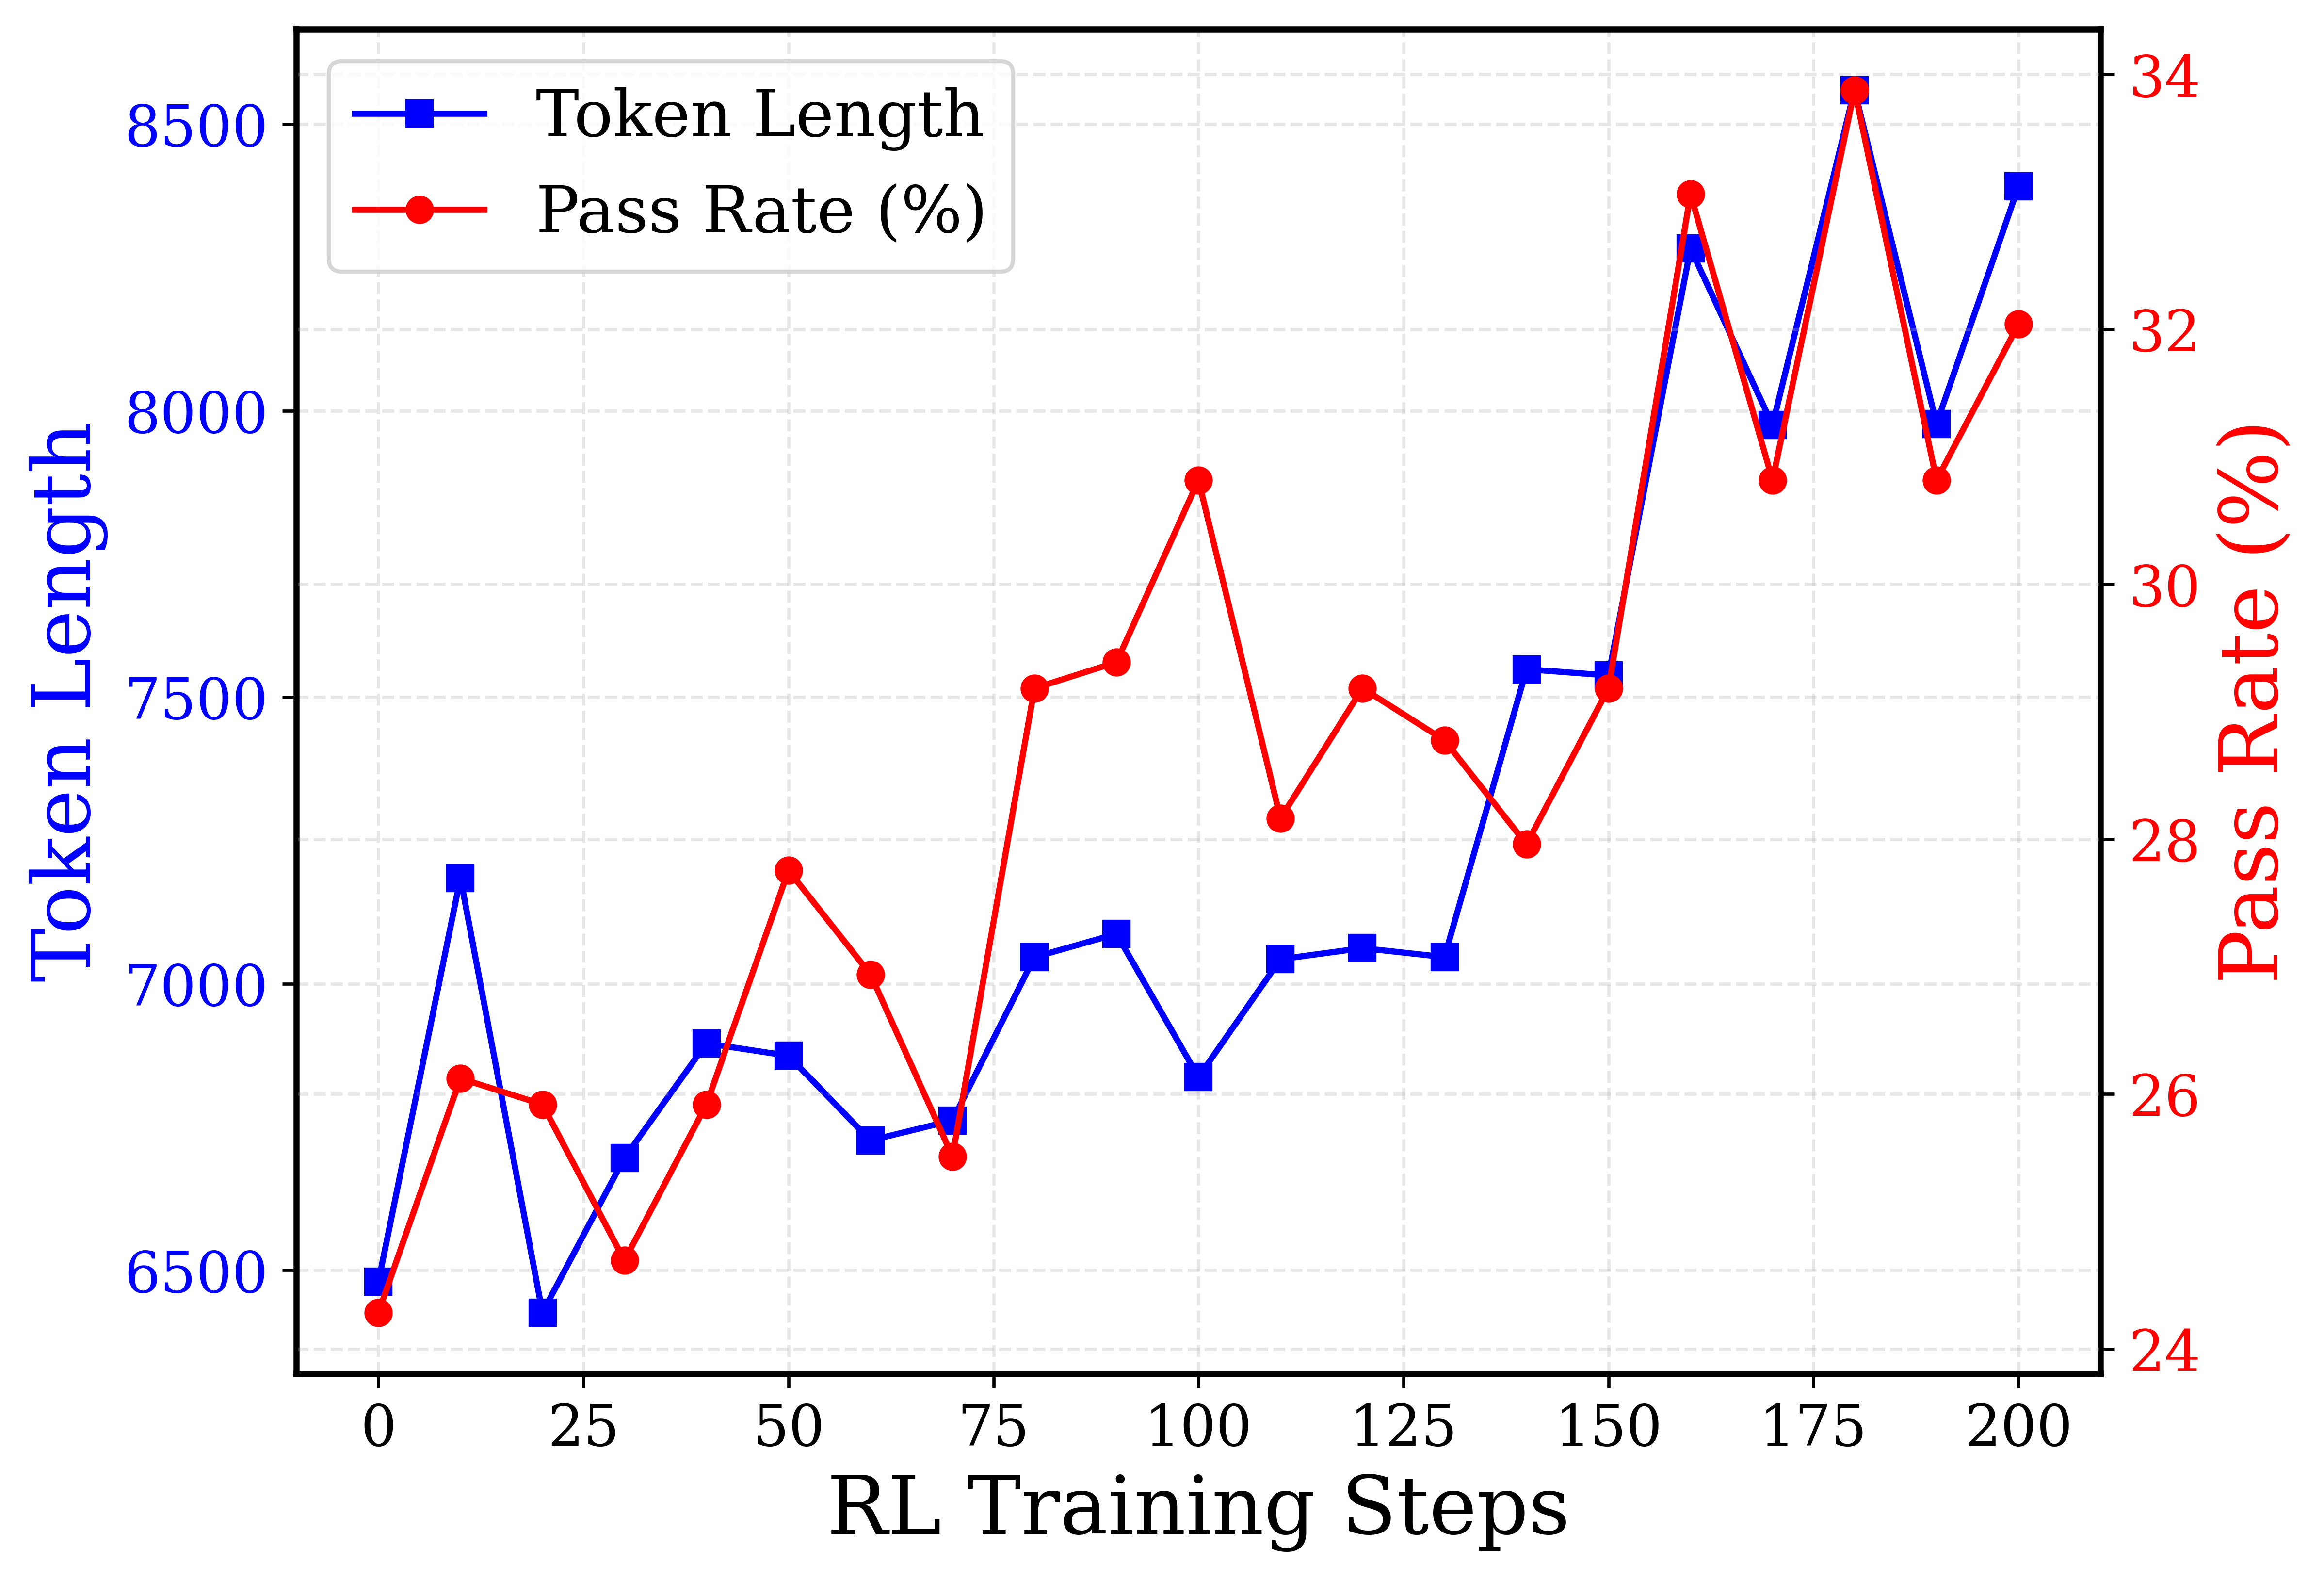
This line chart depicts the relationship between RL Training Steps and two performance metrics: Token Length and Pass Rate (%). The chart visualizes how these metrics change over 200 training steps. The Token Length is plotted on the primary y-axis (left), while the Pass Rate (%) is plotted on the secondary y-axis (right).
### Components/Axes
* **X-axis:** RL Training Steps, ranging from 0 to 200, with markers at intervals of 25.
* **Primary Y-axis (left):** Token Length, ranging from 6500 to 8500, with markers at intervals of 500.
* **Secondary Y-axis (right):** Pass Rate (%), ranging from 24% to 34%, with markers at intervals of 2%.
* **Legend:** Located in the top-left corner.
* Blue line with square markers: Token Length
* Red line with circle markers: Pass Rate (%)
### Detailed Analysis
**Token Length (Blue Line):**
The blue line representing Token Length generally fluctuates around a value of 7000-7500.
* At 0 RL Training Steps, the Token Length is approximately 6500.
* It increases to a peak of approximately 7300 at 25 RL Training Steps.
* It then decreases to around 6600 at 50 RL Training Steps.
* It rises again to approximately 7200 at 75 RL Training Steps.
* The line remains relatively stable between 7100 and 7300 from 100 to 150 RL Training Steps.
* It decreases to approximately 7000 at 175 RL Training Steps.
* Finally, it increases slightly to around 7100 at 200 RL Training Steps.
**Pass Rate (%) (Red Line):**
The red line representing Pass Rate (%) exhibits more pronounced fluctuations.
* At 0 RL Training Steps, the Pass Rate is approximately 26%.
* It decreases to around 25% at 25 RL Training Steps.
* It increases sharply to a peak of approximately 31.5% at 50 RL Training Steps.
* It then decreases to around 26% at 75 RL Training Steps.
* The line increases to approximately 30% at 100 RL Training Steps.
* It rises to a peak of approximately 34% at 150 RL Training Steps.
* It then decreases to approximately 31.5% at 175 RL Training Steps.
* Finally, it decreases to around 32% at 200 RL Training Steps.
### Key Observations
* The Pass Rate (%) shows greater variability than the Token Length.
* There appears to be a slight inverse correlation between the two metrics; when the Pass Rate is high, the Token Length tends to be lower, and vice versa, but this is not consistent.
* The Pass Rate reaches its maximum value at 150 RL Training Steps, while the Token Length is relatively stable around this point.
* The Pass Rate starts at 26% and ends at 32%, showing an overall increase.
* The Token Length starts at 6500 and ends at 7100, showing an overall increase.
### Interpretation
The chart suggests that the RL training process is improving the Pass Rate (%) over time, as evidenced by the overall upward trend. The Token Length also shows a slight increase, indicating that the model is generating longer tokens as training progresses. The fluctuations in both metrics suggest that the training process is not entirely smooth and may be encountering periods of instability or learning plateaus. The peak in Pass Rate at 150 RL Training Steps could indicate a significant learning event or a successful adaptation of the model. The inverse correlation, though not strong, might suggest a trade-off between the length of the generated tokens and the accuracy (Pass Rate) of the model. Further investigation would be needed to determine the optimal balance between these two metrics. The data suggests the model is learning, but the learning process is not linear and requires further tuning or analysis to understand the causes of the fluctuations.