\n
## Dual-Axis Line Chart: RL Training Metrics
### Overview
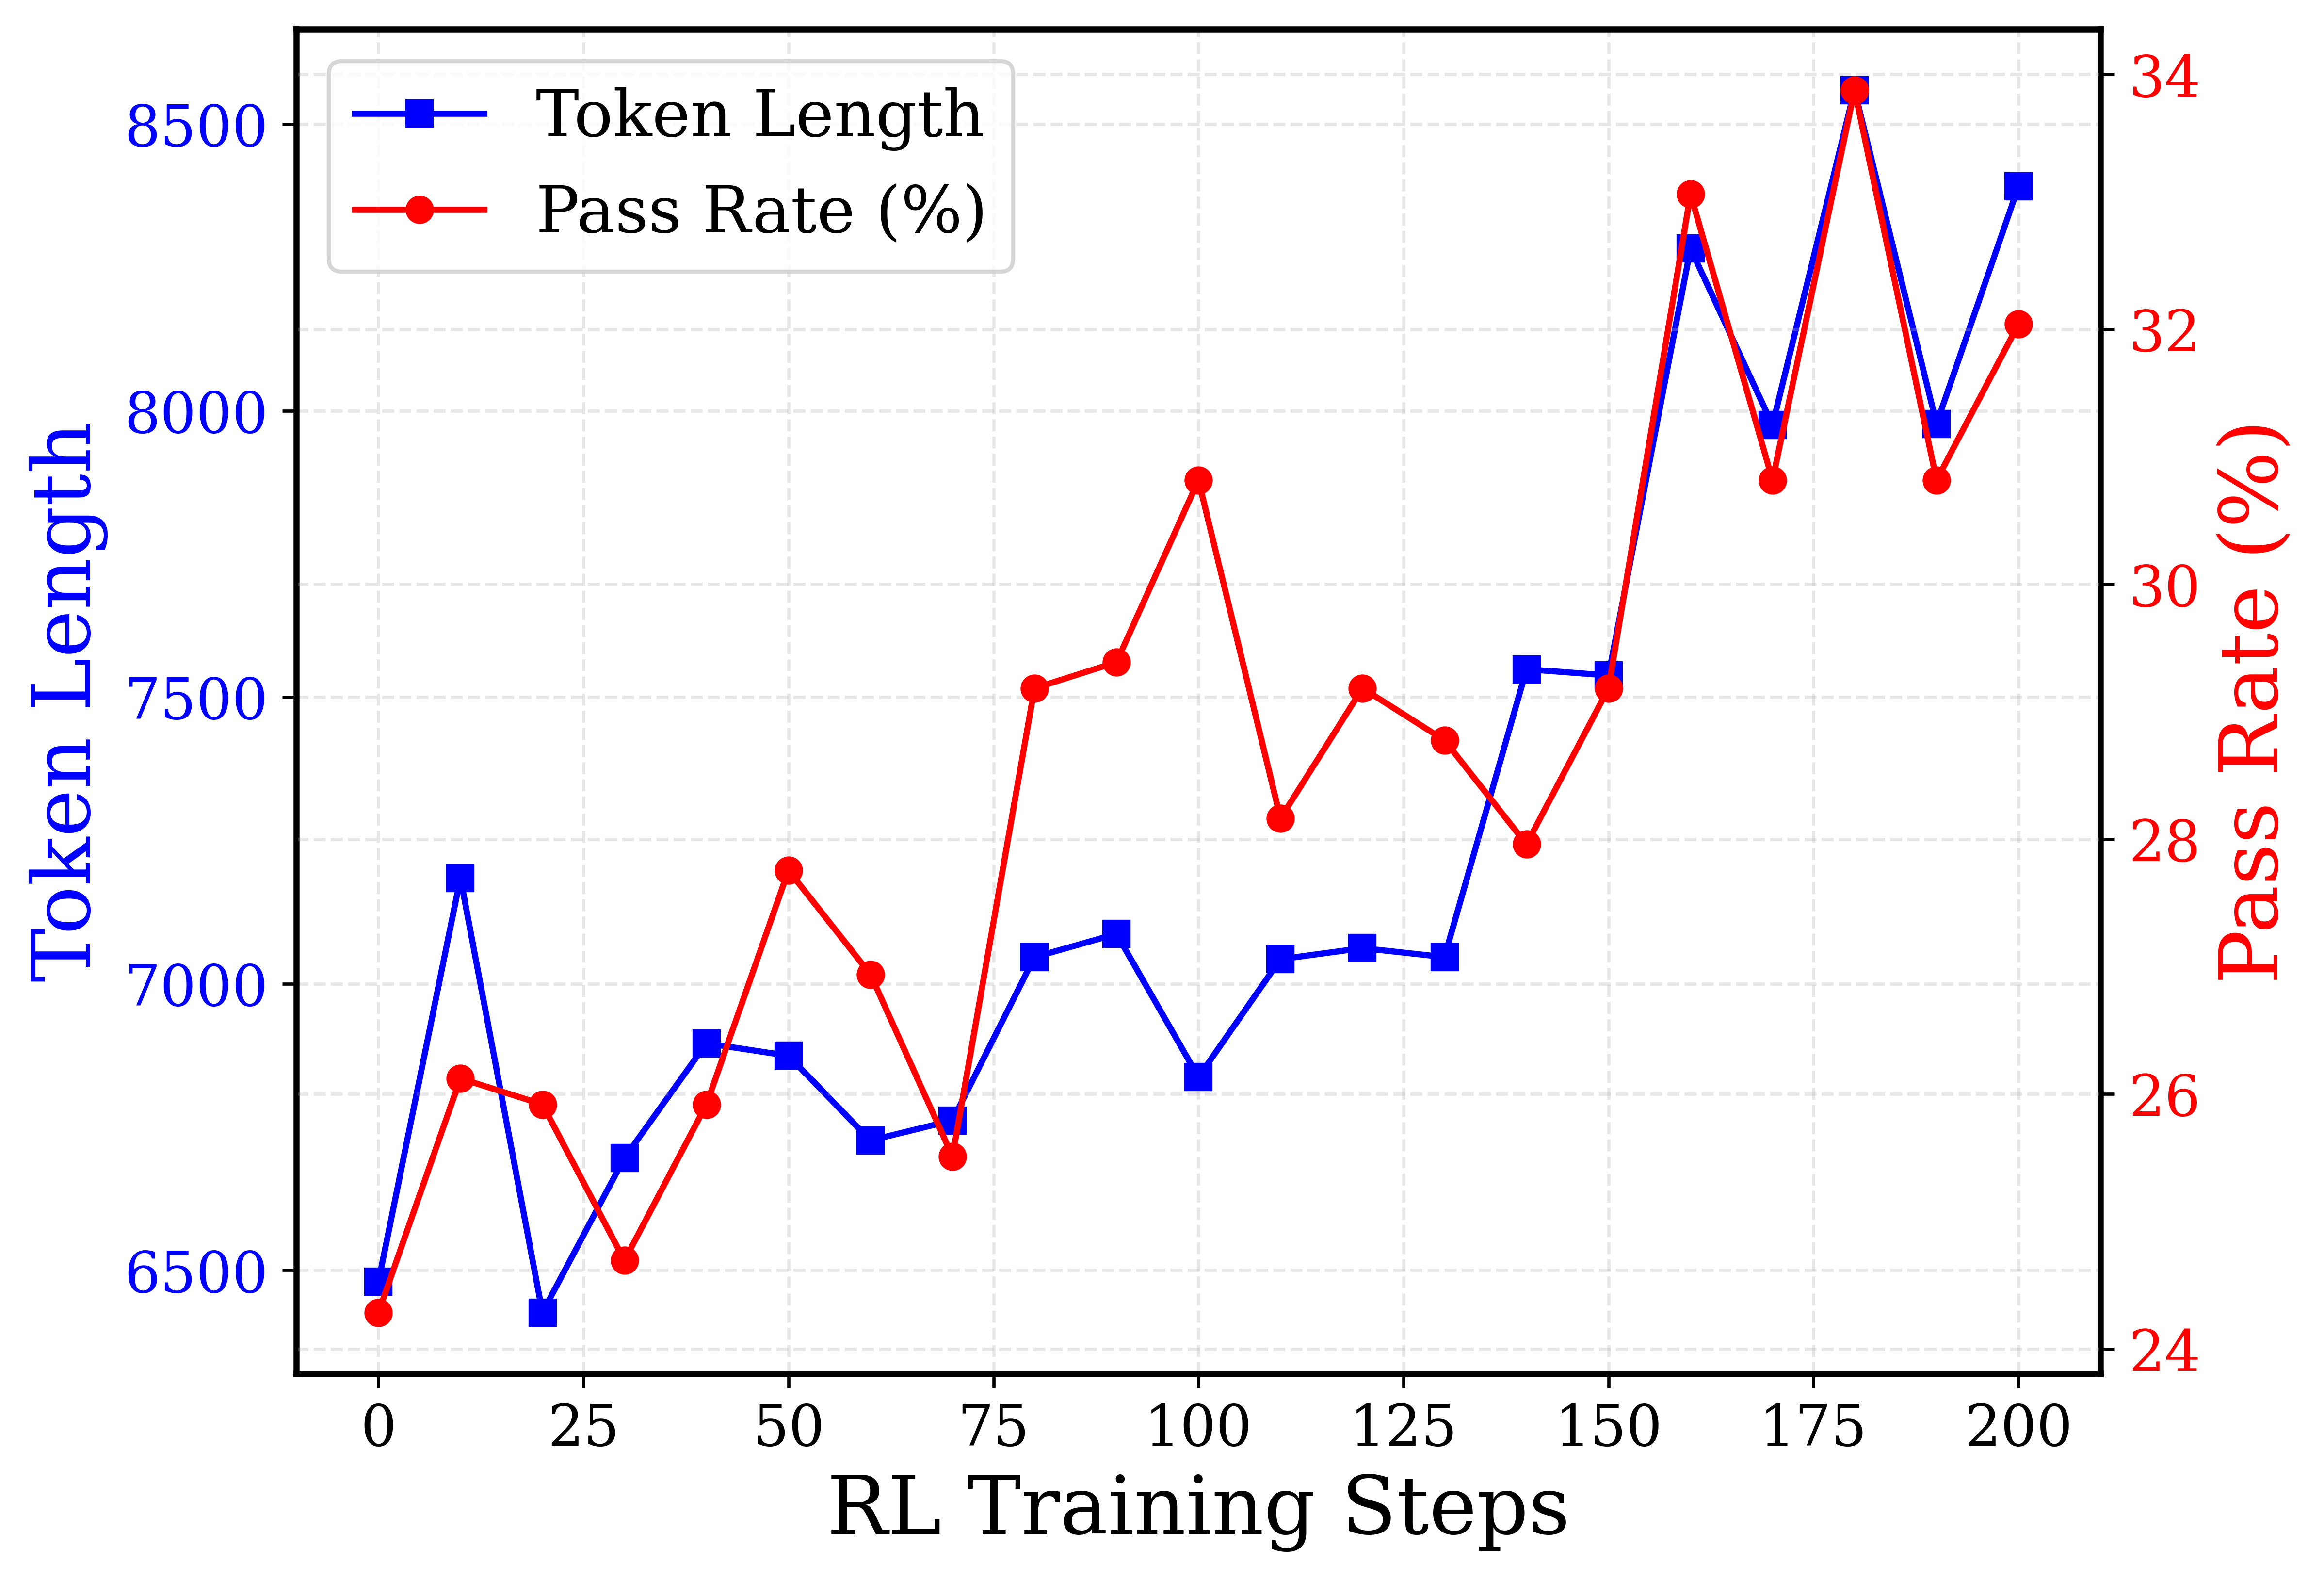
This is a dual-axis line chart tracking two metrics—Token Length and Pass Rate (%)—over the course of 200 Reinforcement Learning (RL) training steps. The chart visualizes the relationship and progression of these two variables throughout the training process.
### Components/Axes
* **X-Axis (Bottom):** Labeled "RL Training Steps". The scale runs from 0 to 200, with major tick marks every 25 steps (0, 25, 50, 75, 100, 125, 150, 175, 200).
* **Primary Y-Axis (Left):** Labeled "Token Length" in blue text. The scale runs from 6500 to 8500, with major tick marks every 500 units (6500, 7000, 7500, 8000, 8500).
* **Secondary Y-Axis (Right):** Labeled "Pass Rate (%)" in red text. The scale runs from 24% to 34%, with major tick marks every 2 percentage points (24, 26, 28, 30, 32, 34).
* **Legend:** Located in the top-left corner of the plot area.
* A blue line with square markers is labeled "Token Length".
* A red line with circle markers is labeled "Pass Rate (%)".
* **Grid:** A light gray dashed grid is present for both axes.
### Detailed Analysis
**Data Series 1: Token Length (Blue Line, Square Markers)**
* **Trend:** The overall trend is upward, starting near 6500 and ending near 8400, but with significant volatility. It features several sharp peaks and troughs.
* **Approximate Data Points (Step, Token Length):**
* (0, ~6480)
* (10, ~7180) - First peak
* (20, ~6420) - Sharp drop
* (30, ~6680)
* (40, ~6900)
* (50, ~6880)
* (60, ~6720)
* (70, ~6750)
* (80, ~7050)
* (90, ~7080)
* (100, ~6850)
* (110, ~7050)
* (120, ~7070)
* (130, ~7050)
* (140, ~7550) - Significant jump
* (150, ~7550)
* (160, ~8300) - Major peak
* (170, ~7980)
* (180, ~8550) - Highest peak
* (190, ~7980)
* (200, ~8400)
**Data Series 2: Pass Rate (%) (Red Line, Circle Markers)**
* **Trend:** The overall trend is also upward, starting near 24.5% and ending near 32.5%. It shows a strong positive correlation with the Token Length line, moving in near-unison through most peaks and troughs.
* **Approximate Data Points (Step, Pass Rate %):**
* (0, ~24.5%)
* (10, ~26.5%)
* (20, ~26.2%)
* (30, ~25.0%)
* (40, ~26.2%)
* (50, ~27.8%)
* (60, ~27.0%)
* (70, ~25.8%)
* (80, ~29.2%)
* (90, ~29.5%)
* (100, ~31.2%) - First major peak
* (110, ~28.2%)
* (120, ~29.2%)
* (130, ~28.8%)
* (140, ~28.0%)
* (150, ~29.2%)
* (160, ~33.2%) - Major peak
* (170, ~31.0%)
* (180, ~34.0%) - Highest peak
* (190, ~31.0%)
* (200, ~32.5%)
### Key Observations
1. **Strong Positive Correlation:** The two lines are highly synchronized. Almost every increase or decrease in Token Length is mirrored by a corresponding change in Pass Rate. This is most evident at the major peaks (steps ~10, 160, 180) and troughs (steps ~20, 70, 100).
2. **Volatile Growth:** Neither metric improves smoothly. Training is characterized by periods of rapid gain followed by sharp corrections, suggesting an unstable or exploratory training dynamic.
3. **Late-Stage Surge:** The most significant gains for both metrics occur after step 150, culminating in the highest values at step 180.
4. **Divergence at Step 100:** A notable point of divergence occurs at step 100. The Pass Rate reaches a local peak (~31.2%), while the Token Length dips to a local trough (~6850). This is the most prominent instance where the two metrics move in opposite directions.
### Interpretation
The chart demonstrates a clear, positive relationship between the length of generated tokens (Token Length) and the success rate (Pass Rate) during this RL training process. This suggests that, for the task being trained, longer responses are strongly associated with higher correctness or quality.
The high volatility indicates the training process is likely in an exploratory phase, where the model is trying different strategies (resulting in varying response lengths) and receiving feedback (the pass rate). The strong correlation implies the reward signal (pass rate) is effectively guiding the model toward generating longer, more successful outputs.
The divergence at step 100 is a critical anomaly. It represents a moment where the model produced shorter outputs that were, on average, more successful. This could indicate the discovery of a more efficient or concise solution path, or it could be a temporary artifact of the training dynamics. Investigating the model's behavior around this step could yield insights into optimizing for both efficiency and effectiveness.
Overall, the data suggests that extending the training beyond 150 steps was highly beneficial, leading to the peak performance observed at step 180. The final data point at 200 shows a slight regression from this peak, which might signal the beginning of over-optimization or the need for further training stabilization.