# Technical Document Extraction: Line Chart Analysis
## 1. Chart Components
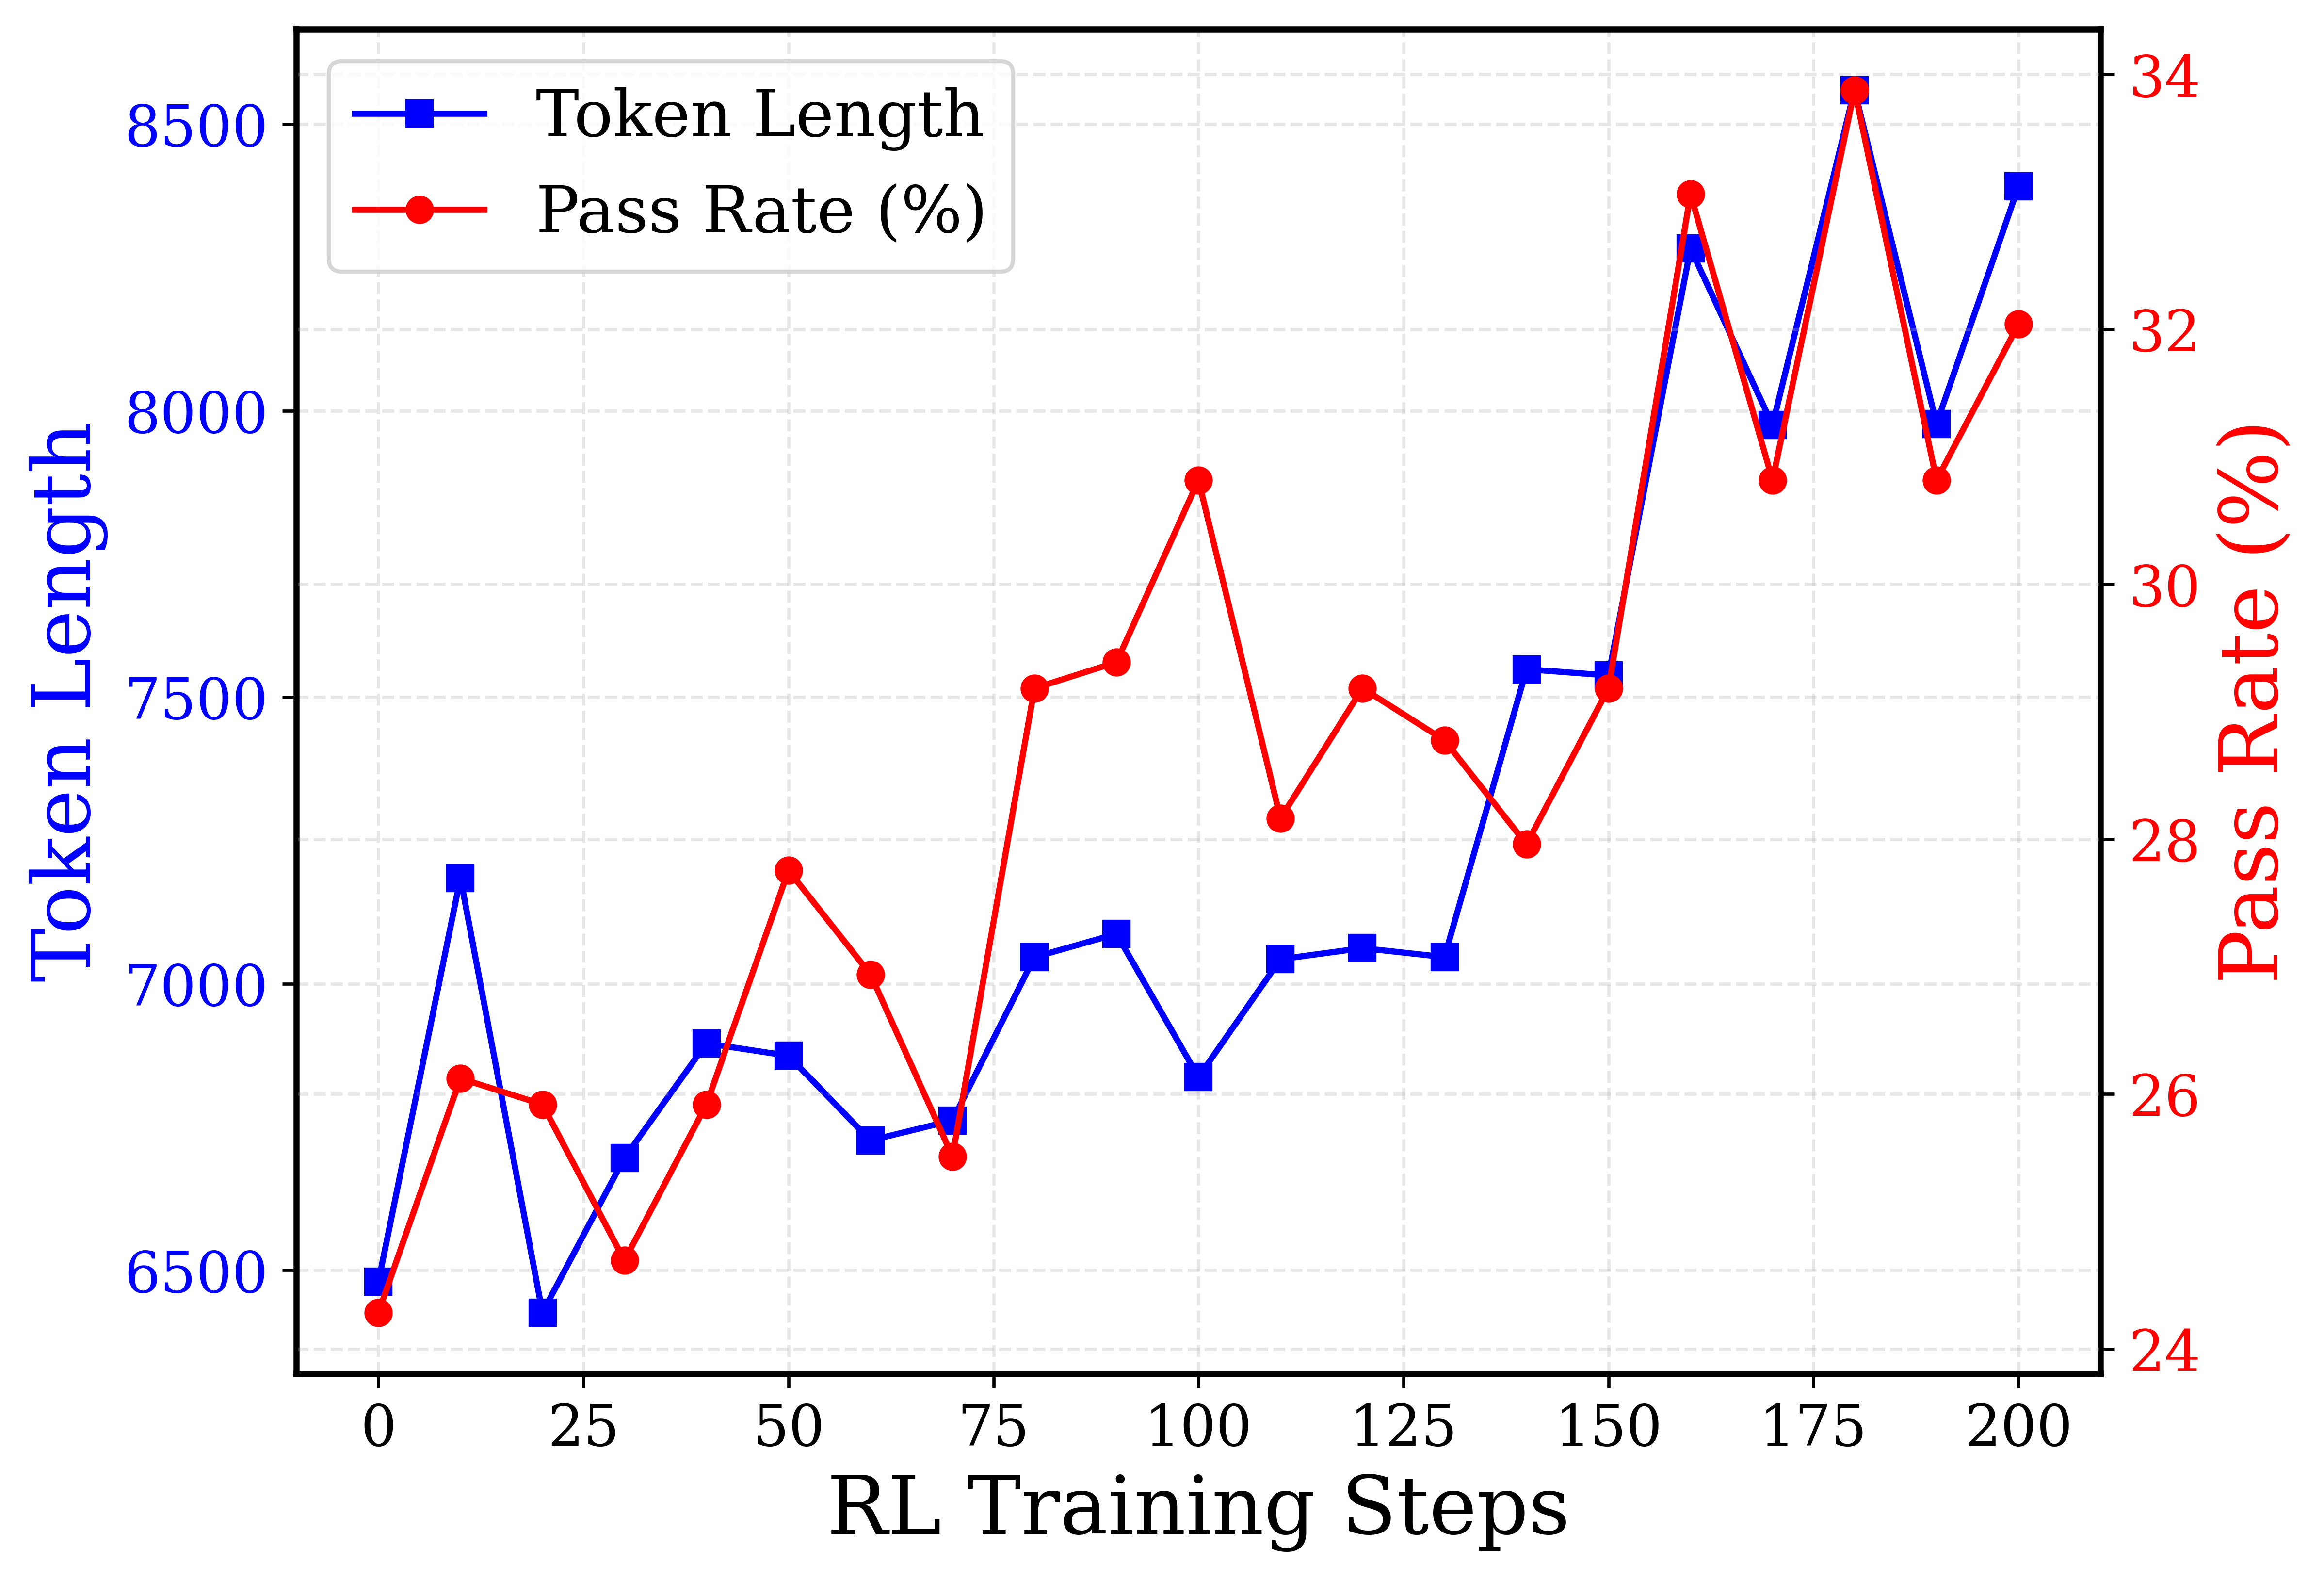
### Legend
- **Position**: Top-left corner
- **Labels**:
- `Token Length` (blue squares)
- `Pass Rate (%)` (red circles)
### Axes
- **X-axis**:
- Label: `RL Training Steps`
- Range: 0 to 200 (increments of 25)
- **Y-axis (Left)**:
- Label: `Token Length`
- Range: 6,500 to 8,500 (increments of 500)
- **Y-axis (Right)**:
- Label: `Pass Rate (%)`
- Range: 24% to 34% (increments of 2%)
## 2. Data Series Analysis
### Token Length (Blue Squares)
- **Trend**:
- Initial increase from 6,500 (step 0) to 7,200 (step 25)
- Fluctuates between 6,800–7,500 until step 150
- Sharp rise to 8,300 (step 175), then drops to 8,000 (step 190)
- Final peak at 8,400 (step 200)
- **Key Data Points**:
| Step | Token Length |
|------|--------------|
| 0 | 6,500 |
| 25 | 7,200 |
| 50 | 6,900 |
| 75 | 7,100 |
| 100 | 6,850 |
| 125 | 7,050 |
| 150 | 7,500 |
| 175 | 8,300 |
| 190 | 8,000 |
| 200 | 8,400 |
### Pass Rate (%) (Red Circles)
- **Trend**:
- Gradual increase from 24% (step 0) to 34% (step 175)
- Sharp drop to 32% (step 190), then slight recovery to 32% (step 200)
- **Key Data Points**:
| Step | Pass Rate (%) |
|------|---------------|
| 0 | 24% |
| 25 | 26% |
| 50 | 28% |
| 75 | 30% |
| 100 | 33% |
| 125 | 31% |
| 150 | 30% |
| 175 | 34% |
| 190 | 32% |
| 200 | 32% |
## 3. Cross-Series Correlation
- **Inverse Relationship**:
- Token Length peaks (8,300 at step 175) coincide with Pass Rate peak (34%)
- Divergence at step 190: Token Length drops to 8,000 while Pass Rate remains at 32%
- **Convergence**:
- Both metrics stabilize near 8,000/32% at step 200
## 4. Spatial Grounding
- **Legend Coordinates**: Top-left corner (exact pixel position unspecified)
- **Data Point Validation**:
- All blue squares match `Token Length` values
- All red circles match `Pass Rate (%)` values
## 5. Trend Verification
- **Token Length**:
- Initial volatility (steps 0–50)
- Stabilization phase (steps 50–150)
- Exponential growth (steps 150–175)
- Post-peak decline (steps 175–190)
- **Pass Rate**:
- Linear growth (steps 0–175)
- Post-peak correction (steps 175–200)
## 6. Data Table Reconstruction
| RL Training Steps | Token Length | Pass Rate (%) |
|-------------------|--------------|---------------|
| 0 | 6,500 | 24% |
| 25 | 7,200 | 26% |
| 50 | 6,900 | 28% |
| 75 | 7,100 | 30% |
| 100 | 6,850 | 33% |
| 125 | 7,050 | 31% |
| 150 | 7,500 | 30% |
| 175 | 8,300 | 34% |
| 190 | 8,000 | 32% |
| 200 | 8,400 | 32% |
## 7. Critical Observations
1. **Training Efficiency**:
- Pass Rate improves significantly (24% → 34%) despite Token Length fluctuations
- Optimal performance at step 175 (8,300 tokens, 34% pass rate)
2. **Resource Utilization**:
- Token Length increases by 30% (6,500 → 8,400) over 200 steps
- No direct correlation between Token Length and Pass Rate beyond step 175
3. **Stability**:
- Final metrics (step 200) show convergence at 8,400 tokens and 32% pass rate
## 8. Language Notes
- **Primary Language**: English (all labels, axis titles, and annotations)
- **No Secondary Languages Detected**