## Line Chart: NDCG@10/% vs. Dimensions
### Overview
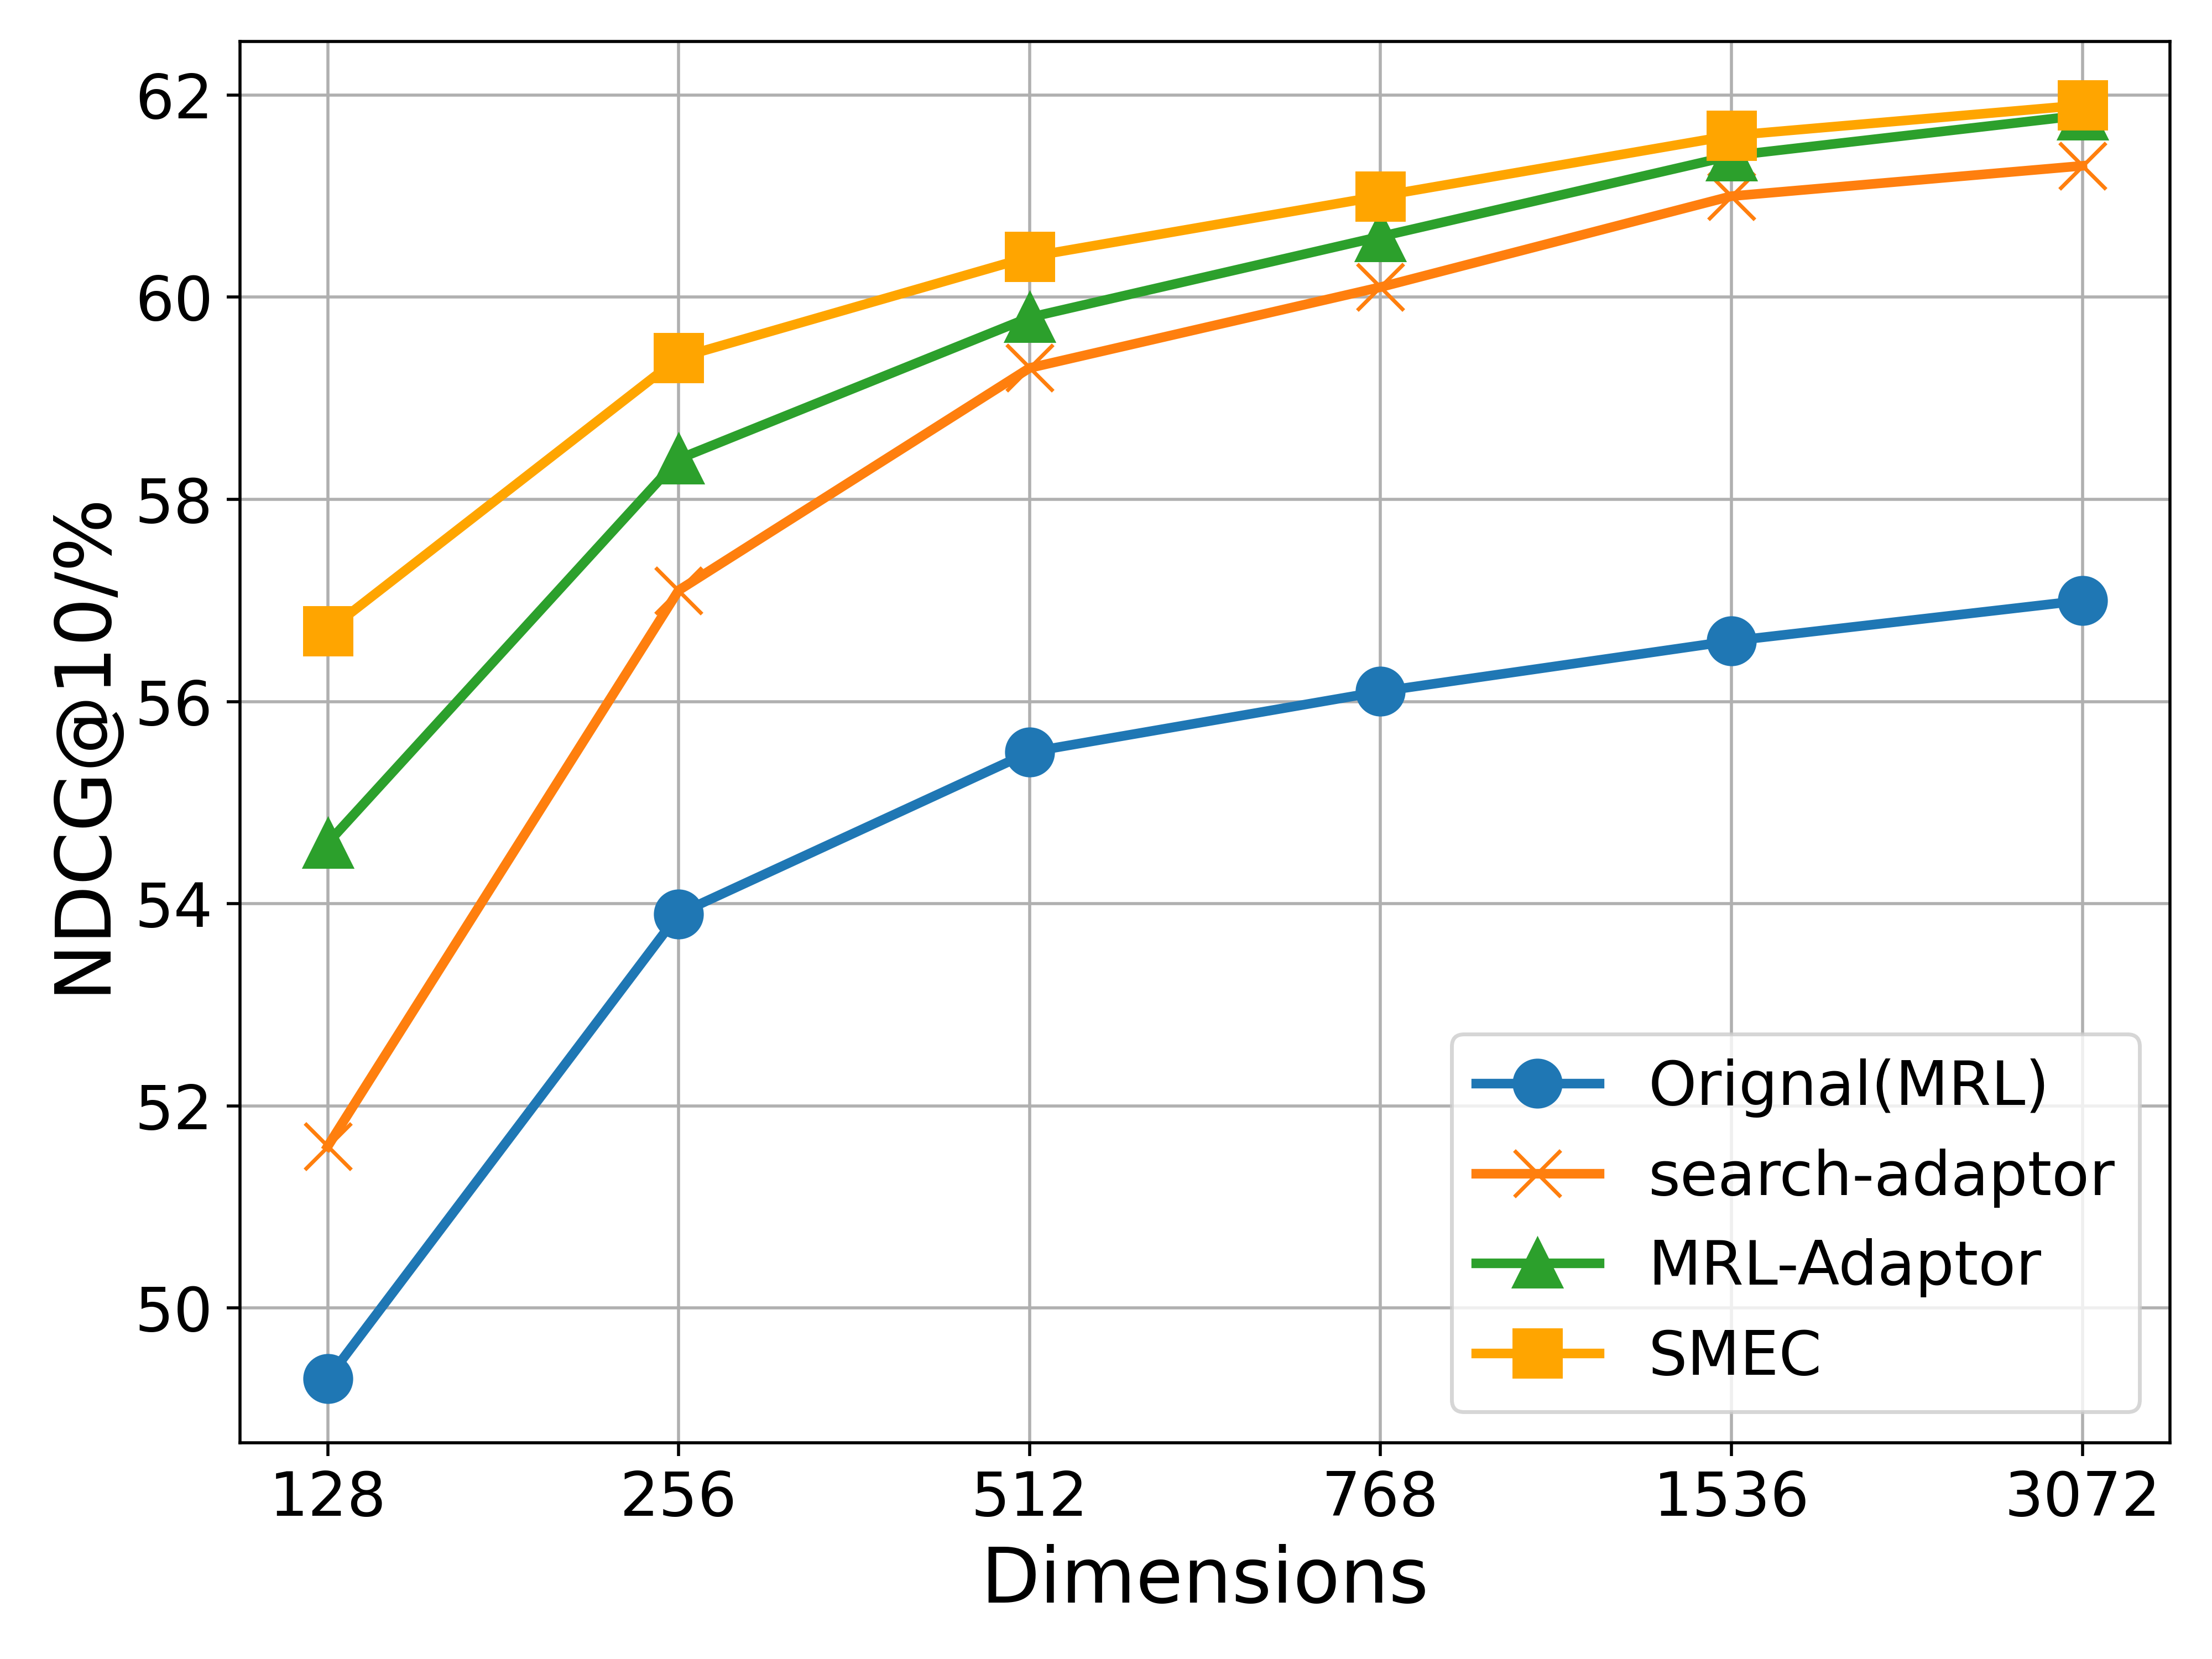
The image is a line chart comparing the performance of four different models (Original(MRL), search-adaptor, MRL-Adaptor, and SMEC) based on their NDCG@10/% scores across varying dimensions. The x-axis represents the dimensions, and the y-axis represents the NDCG@10/% score.
### Components/Axes
* **X-axis:** Dimensions, with values 128, 256, 512, 768, 1536, and 3072.
* **Y-axis:** NDCG@10/%, ranging from 50 to 62 with increments of 2.
* **Legend:** Located in the bottom-right corner, it identifies each model with a specific color and marker:
* Blue with circle marker: Original(MRL)
* Orange with cross marker: search-adaptor
* Green with triangle marker: MRL-Adaptor
* Yellow/Orange with square marker: SMEC
### Detailed Analysis
* **Original(MRL) (Blue, Circle):** The line starts at approximately 49.3 at dimension 128, increases to approximately 53.9 at 256, then to 55.5 at 512, 56.1 at 768, 56.6 at 1536, and finally reaches approximately 57 at 3072. The trend is generally upward, but the rate of increase slows down as dimensions increase.
* **search-adaptor (Orange, Cross):** The line starts at approximately 51.5 at dimension 128, increases to approximately 57.2 at 256, then to 59.3 at 512, 60.1 at 768, 61 at 1536, and finally reaches approximately 61.8 at 3072. The trend is upward, with a steeper initial increase.
* **MRL-Adaptor (Green, Triangle):** The line starts at approximately 54.6 at dimension 128, increases to approximately 58.4 at 256, then to 59.7 at 512, 60.4 at 768, 61.2 at 1536, and finally reaches approximately 61.8 at 3072. The trend is upward, with a moderate initial increase.
* **SMEC (Yellow/Orange, Square):** The line starts at approximately 56.7 at dimension 128, increases to approximately 59.4 at 256, then to 60.4 at 512, 60.8 at 768, 61.5 at 1536, and finally reaches approximately 61.9 at 3072. The trend is upward, with a relatively high initial value.
### Key Observations
* SMEC consistently performs better than the other models up to dimension 1536.
* The Original(MRL) model has the lowest NDCG@10/% scores across all dimensions.
* All models show diminishing returns as dimensions increase, with the curves flattening out.
* At higher dimensions (1536 and 3072), the performance of search-adaptor, MRL-Adaptor, and SMEC converges.
### Interpretation
The chart illustrates the impact of dimensionality on the performance of different models, as measured by NDCG@10/%. The Original(MRL) model appears to be less effective at higher dimensions compared to the other three models. The search-adaptor, MRL-Adaptor, and SMEC models show similar performance at higher dimensions, suggesting that increasing dimensions beyond a certain point may not significantly improve their performance. The diminishing returns observed across all models indicate that there may be an optimal dimensionality for these models, beyond which further increases provide minimal benefit.