## Line Chart: NDCG@10% vs. Dimensions
### Overview
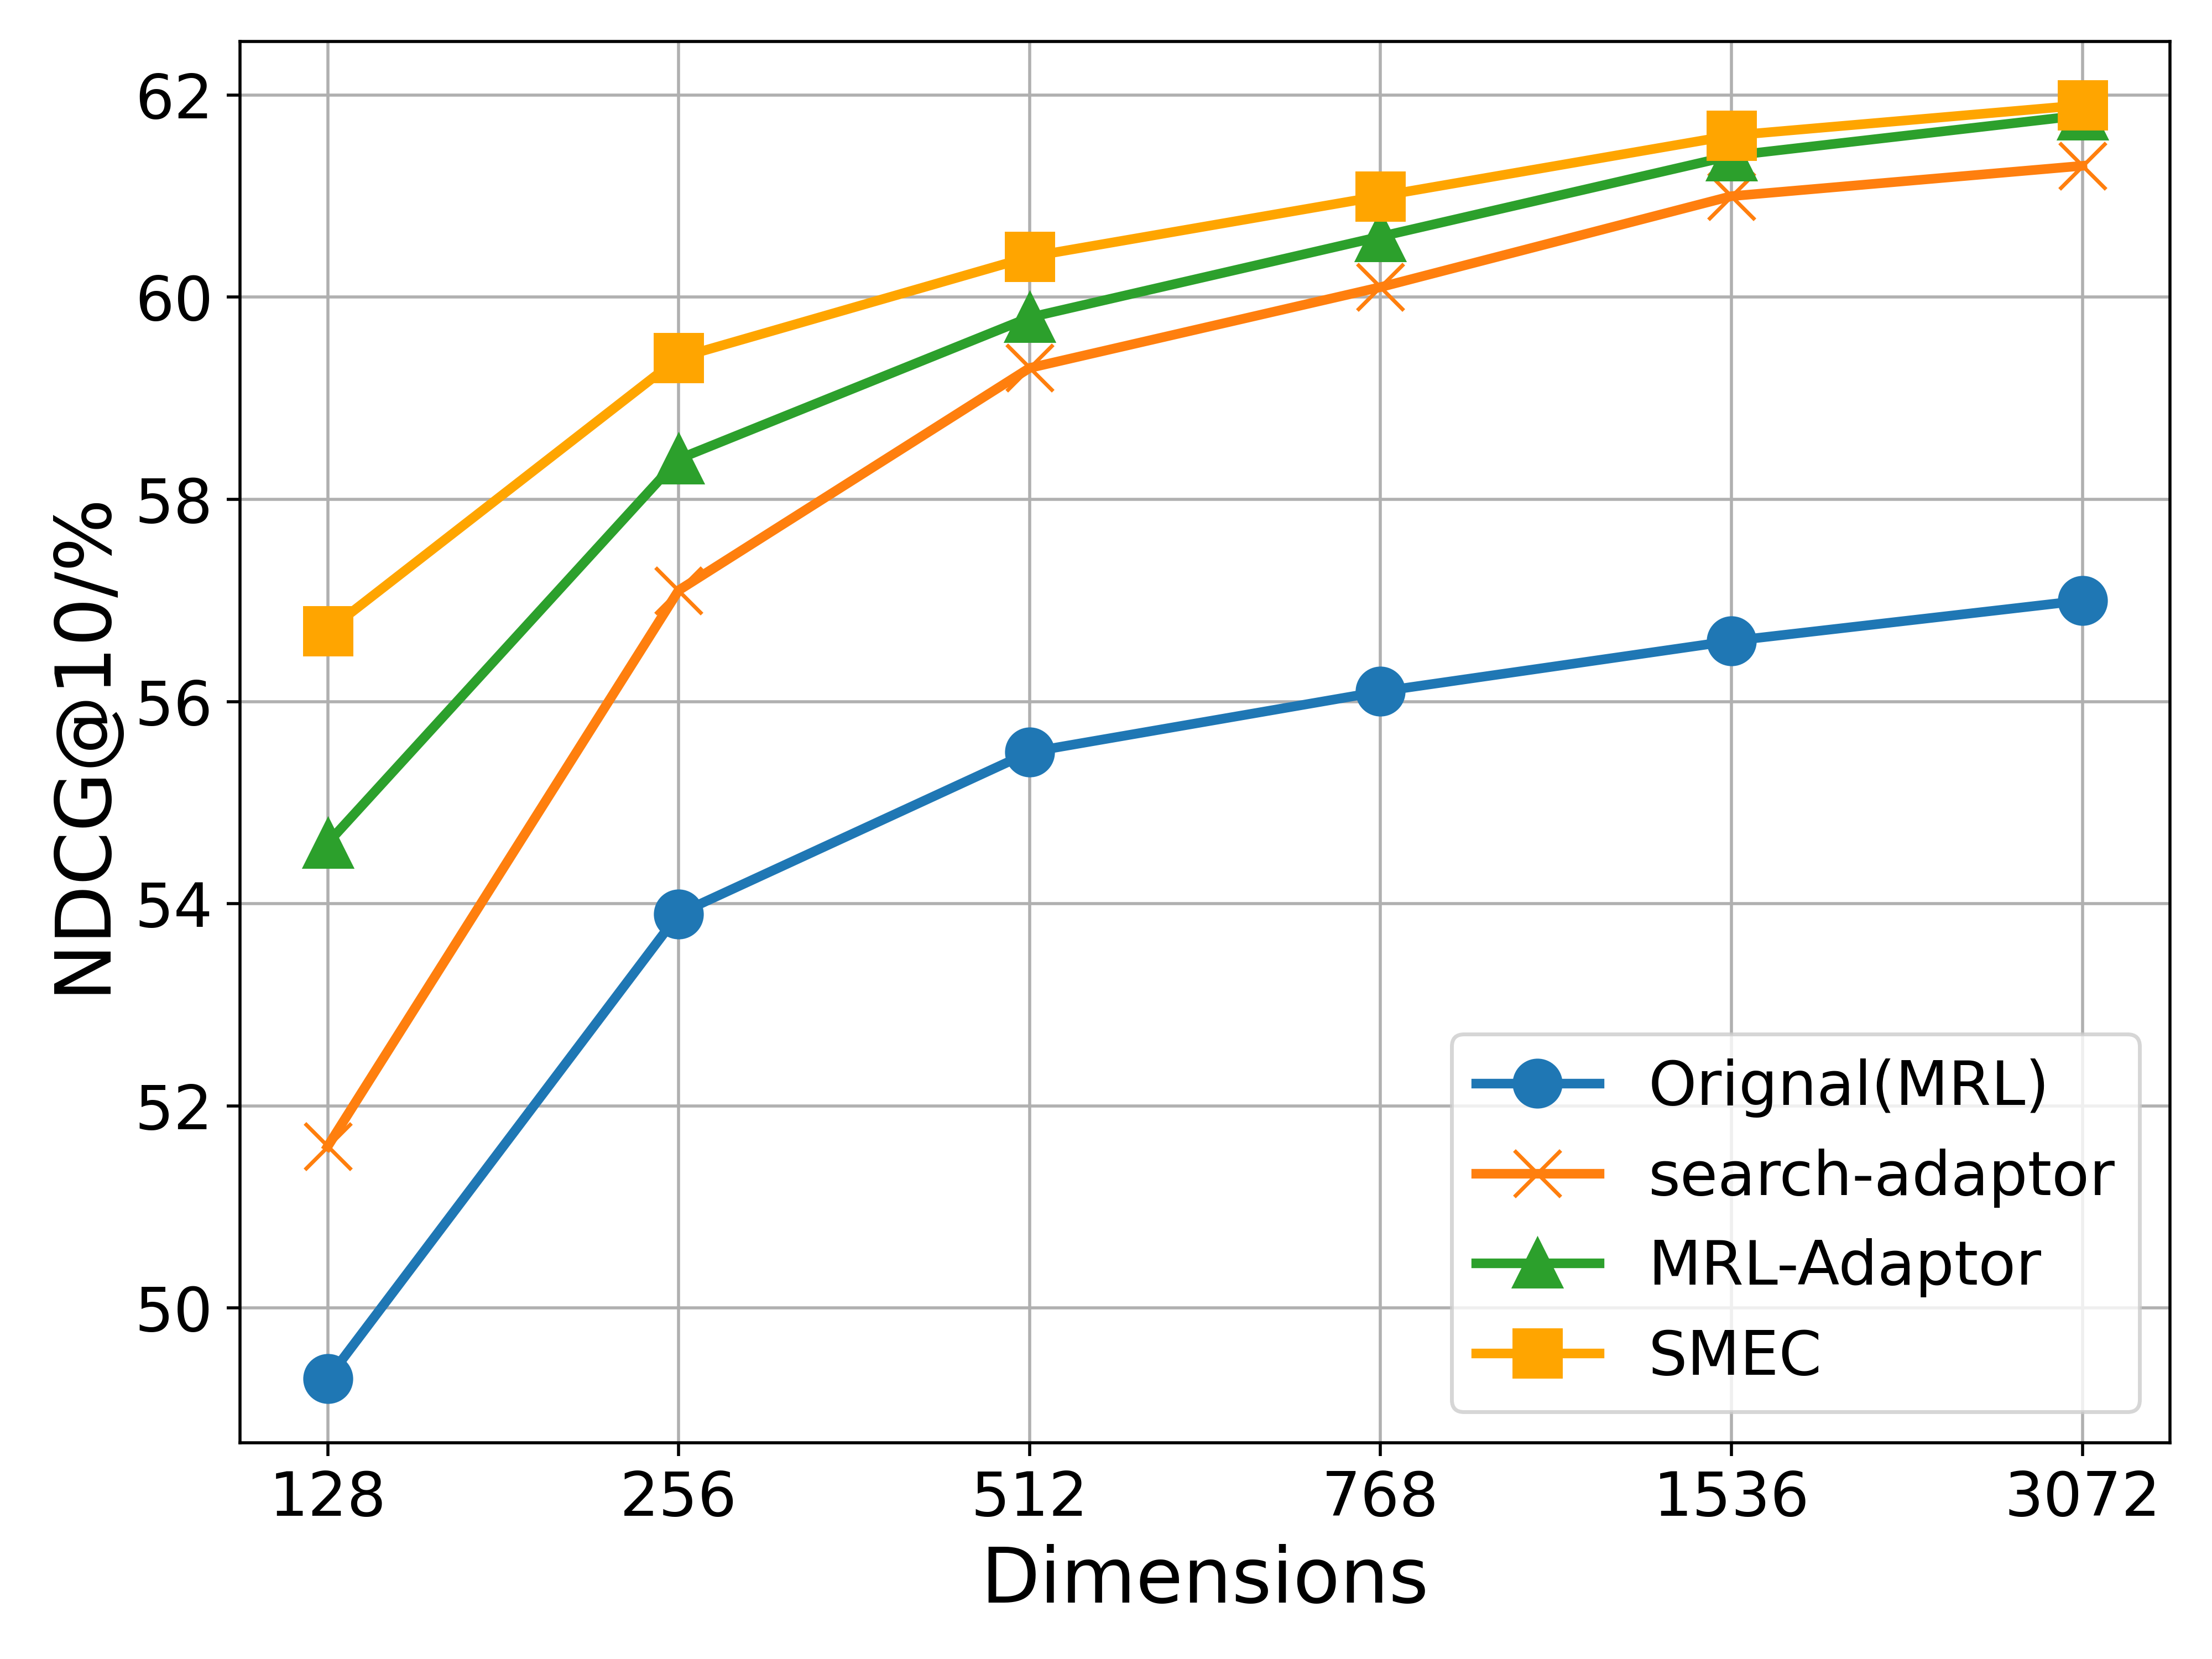
This line chart visualizes the relationship between the dimensions of a model and its NDCG@10% performance. Four different model configurations are compared: Original(MRL), search-adaptor, MRL-Adaptor, and SMEC. The chart shows how the NDCG@10% metric changes as the number of dimensions increases from 128 to 3072.
### Components/Axes
* **X-axis:** Dimensions, with markers at 128, 256, 512, 768, 1536, and 3072.
* **Y-axis:** NDCG@10%, ranging from approximately 50% to 62%.
* **Legend:** Located in the bottom-right corner, identifying the four data series:
* Original(MRL) - Blue line with circular markers.
* search-adaptor - Orange line with cross markers.
* MRL-Adaptor - Green line with triangular markers.
* SMEC - Yellow line with square markers.
* **Gridlines:** A light gray grid is present to aid in reading values.
### Detailed Analysis
Here's a breakdown of each data series, with approximate values read from the chart:
* **Original(MRL) (Blue):** This line shows a generally upward trend, but with diminishing returns.
* 128 Dimensions: ~51.5%
* 256 Dimensions: ~54.5%
* 512 Dimensions: ~55.5%
* 768 Dimensions: ~56.0%
* 1536 Dimensions: ~56.0%
* 3072 Dimensions: ~56.0%
* **search-adaptor (Orange):** This line exhibits a strong initial increase, then plateaus.
* 128 Dimensions: ~52.0%
* 256 Dimensions: ~59.0%
* 512 Dimensions: ~60.5%
* 768 Dimensions: ~60.5%
* 1536 Dimensions: ~61.0%
* 3072 Dimensions: ~61.0%
* **MRL-Adaptor (Green):** This line shows a consistent upward trend, reaching the highest values.
* 128 Dimensions: ~54.5%
* 256 Dimensions: ~59.0%
* 512 Dimensions: ~59.5%
* 768 Dimensions: ~60.5%
* 1536 Dimensions: ~61.5%
* 3072 Dimensions: ~61.5%
* **SMEC (Yellow):** This line demonstrates a rapid increase initially, then levels off, similar to search-adaptor.
* 128 Dimensions: ~56.0%
* 256 Dimensions: ~59.0%
* 512 Dimensions: ~59.5%
* 768 Dimensions: ~60.5%
* 1536 Dimensions: ~61.0%
* 3072 Dimensions: ~61.0%
### Key Observations
* The MRL-Adaptor consistently outperforms the other models across all dimensions.
* The Original(MRL) model shows the lowest performance and the smallest improvement with increasing dimensions.
* The search-adaptor and SMEC models exhibit similar performance, with a significant initial gain that plateaus at higher dimensions.
* All models show diminishing returns in NDCG@10% as the number of dimensions increases beyond 768.
### Interpretation
The data suggests that increasing the dimensionality of the model generally improves performance, as measured by NDCG@10%, up to a certain point. However, the benefit of adding more dimensions diminishes as the dimensionality increases. The MRL-Adaptor configuration appears to be the most effective, consistently achieving the highest NDCG@10% scores. The Original(MRL) model, without adaptation, is the least effective.
The plateauing effect observed in the search-adaptor and SMEC models suggests that the models may be reaching a point of saturation, where adding more dimensions does not provide significant additional information or improve the model's ability to discriminate between relevant and irrelevant results. The differences between the models likely stem from the specific adaptation techniques employed (search-adaptor, MRL-Adaptor, SMEC) and their ability to leverage the increased dimensionality effectively. The initial steep increase in performance for search-adaptor and SMEC could be due to the model learning more robust features with the initial increase in dimensions, but the subsequent plateau indicates that the added complexity doesn't translate into further gains.