## Line Chart: Performance (NDCG@10) vs. Embedding Dimensions
### Overview
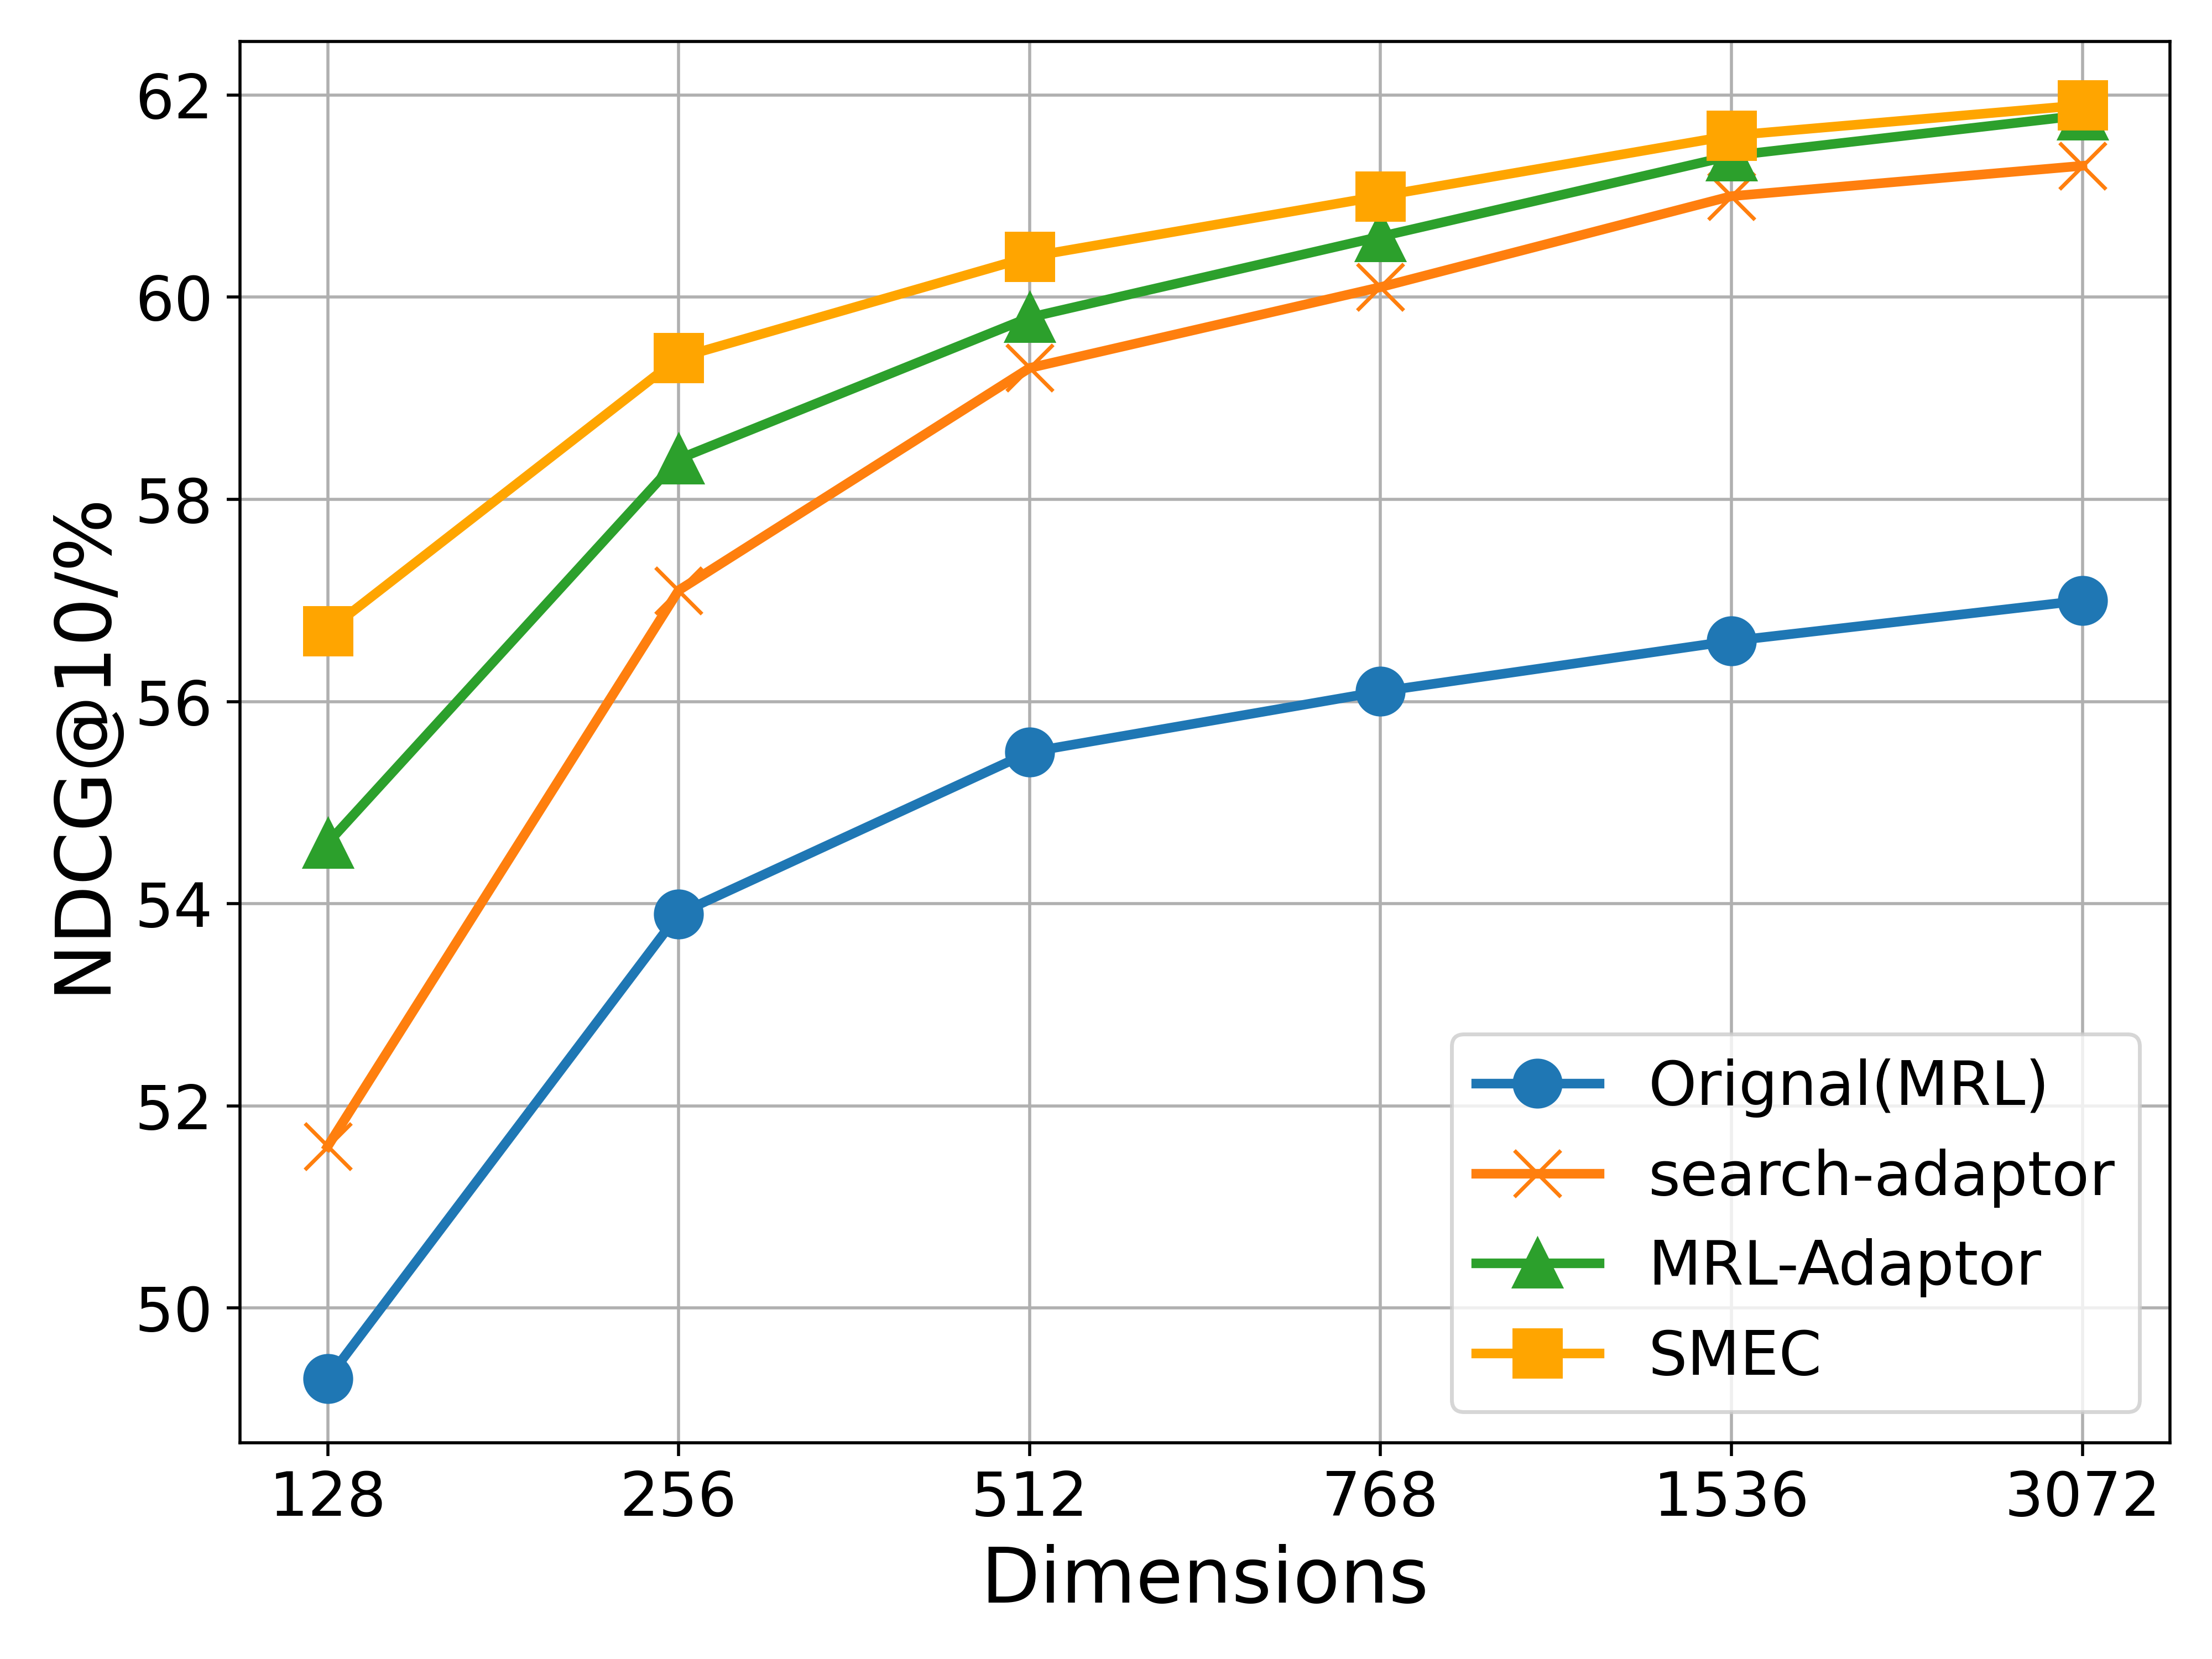
The image is a line chart comparing the performance of four different methods or models as a function of embedding dimension size. The performance metric is NDCG@10 (Normalized Discounted Cumulative Gain at rank 10), expressed as a percentage. The chart demonstrates how each method's effectiveness scales with increased dimensionality.
### Components/Axes
* **Chart Type:** Multi-series line chart with markers.
* **Y-Axis:**
* **Label:** `NDCG@10/%`
* **Scale:** Linear, ranging from 50 to 62.
* **Major Ticks:** 50, 52, 54, 56, 58, 60, 62.
* **X-Axis:**
* **Label:** `Dimensions`
* **Scale:** Appears to be logarithmic (base 2), with discrete points.
* **Tick Labels (Categories):** 128, 256, 512, 768, 1536, 3072.
* **Legend:** Located in the bottom-right quadrant of the chart area.
* **Position:** Bottom-right, inside the plot area.
* **Series (in order of appearance in legend):**
1. `Original(MRL)` - Blue line with circle markers.
2. `search-adaptor` - Orange line with 'x' (cross) markers.
3. `MRL-Adaptor` - Green line with triangle markers.
4. `SMEC` - Yellow/Gold line with square markers.
### Detailed Analysis
**Data Series and Approximate Values:**
Values are estimated based on the grid lines. The trend for all series is upward (positive slope) as dimensions increase.
1. **Original(MRL) [Blue, Circle]:**
* **Trend:** Steady, moderate upward slope. Consistently the lowest-performing series.
* **Data Points (Approx.):**
* 128: ~49.2%
* 256: ~53.9%
* 512: ~55.5%
* 768: ~56.1%
* 1536: ~56.6%
* 3072: ~57.0%
2. **search-adaptor [Orange, 'x']:**
* **Trend:** Steep initial increase from 128 to 512 dimensions, then a more gradual rise. Performs better than Original(MRL) but worse than MRL-Adaptor and SMEC.
* **Data Points (Approx.):**
* 128: ~51.6%
* 256: ~57.1%
* 512: ~59.3%
* 768: ~60.1%
* 1536: ~61.0%
* 3072: ~61.3%
3. **MRL-Adaptor [Green, Triangle]:**
* **Trend:** Strong upward slope, closely following but slightly below the SMEC line. Second-best performer.
* **Data Points (Approx.):**
* 128: ~54.6%
* 256: ~58.4%
* 512: ~59.8%
* 768: ~60.5%
* 1536: ~61.3%
* 3072: ~61.8%
4. **SMEC [Yellow/Gold, Square]:**
* **Trend:** Consistently the highest-performing series across all dimensions. Shows a strong, steady increase.
* **Data Points (Approx.):**
* 128: ~56.7%
* 256: ~59.4%
* 512: ~60.4%
* 768: ~61.0%
* 1536: ~61.6%
* 3072: ~61.9%
### Key Observations
1. **Performance Hierarchy:** A clear and consistent performance hierarchy is maintained across all tested dimensions: **SMEC > MRL-Adaptor > search-adaptor > Original(MRL)**.
2. **Diminishing Returns:** All curves show signs of diminishing returns. The performance gain from doubling dimensions is much larger at the lower end (e.g., 128 to 256) than at the higher end (e.g., 1536 to 3072).
3. **Convergence at High Dimensions:** The performance gaps between the top three methods (SMEC, MRL-Adaptor, search-adaptor) narrow significantly as dimensions increase towards 3072, suggesting they may be approaching a performance ceiling for this task.
4. **Baseline Performance:** The `Original(MRL)` method serves as a baseline, and all three "adaptor" or enhanced methods (`search-adaptor`, `MRL-Adaptor`, `SMEC`) provide substantial improvements over it, especially at lower dimensions.
### Interpretation
This chart likely comes from a research paper or technical report in the field of information retrieval, machine learning, or natural language processing, where embedding dimensionality is a key hyperparameter.
* **What the data suggests:** The data demonstrates that the proposed methods (`search-adaptor`, `MRL-Adaptor`, and particularly `SMEC`) are effective at improving ranking performance (NDCG@10) over a baseline (`Original(MRL)`). The `SMEC` method appears to be the most efficient, achieving higher performance at every dimension size.
* **How elements relate:** The x-axis (Dimensions) represents a resource cost (model size, computational complexity). The y-axis (NDCG@10) represents the quality of the output. The chart visualizes the trade-off between cost and quality for each method. The steeper slopes of the adaptor methods at lower dimensions indicate they are more "data- or parameter-efficient" – they achieve a greater performance boost per added dimension compared to the baseline.
* **Notable trends/anomalies:** The most notable trend is the consistent superiority of SMEC. There are no anomalous data points; all series follow smooth, logical trajectories. The convergence at the high end is a common phenomenon in scaling experiments, indicating that simply increasing model size yields progressively smaller benefits, and architectural innovations (like those in SMEC) become more critical for pushing performance boundaries. The chart argues that using an advanced method like SMEC allows one to achieve the same performance as a simpler method but with a much smaller (and thus cheaper) model dimension. For example, SMEC at 256 dimensions (~59.4%) outperforms Original(MRL) at 3072 dimensions (~57.0%).