TECHNICAL ASSET FINGERPRINT
38ff7e21c0829b8e28e21c17
Click to view fullscreen
Press ESC or click to close
FOUND IN PAPERS
EXPERT: healer-alpha-free VERSION 1
RUNTIME: free/openrouter/healer-alpha
INTEL_VERIFIED
## Box Plot Comparison: Statistical Parity (DSP) Across Fairness Scenarios
### Overview
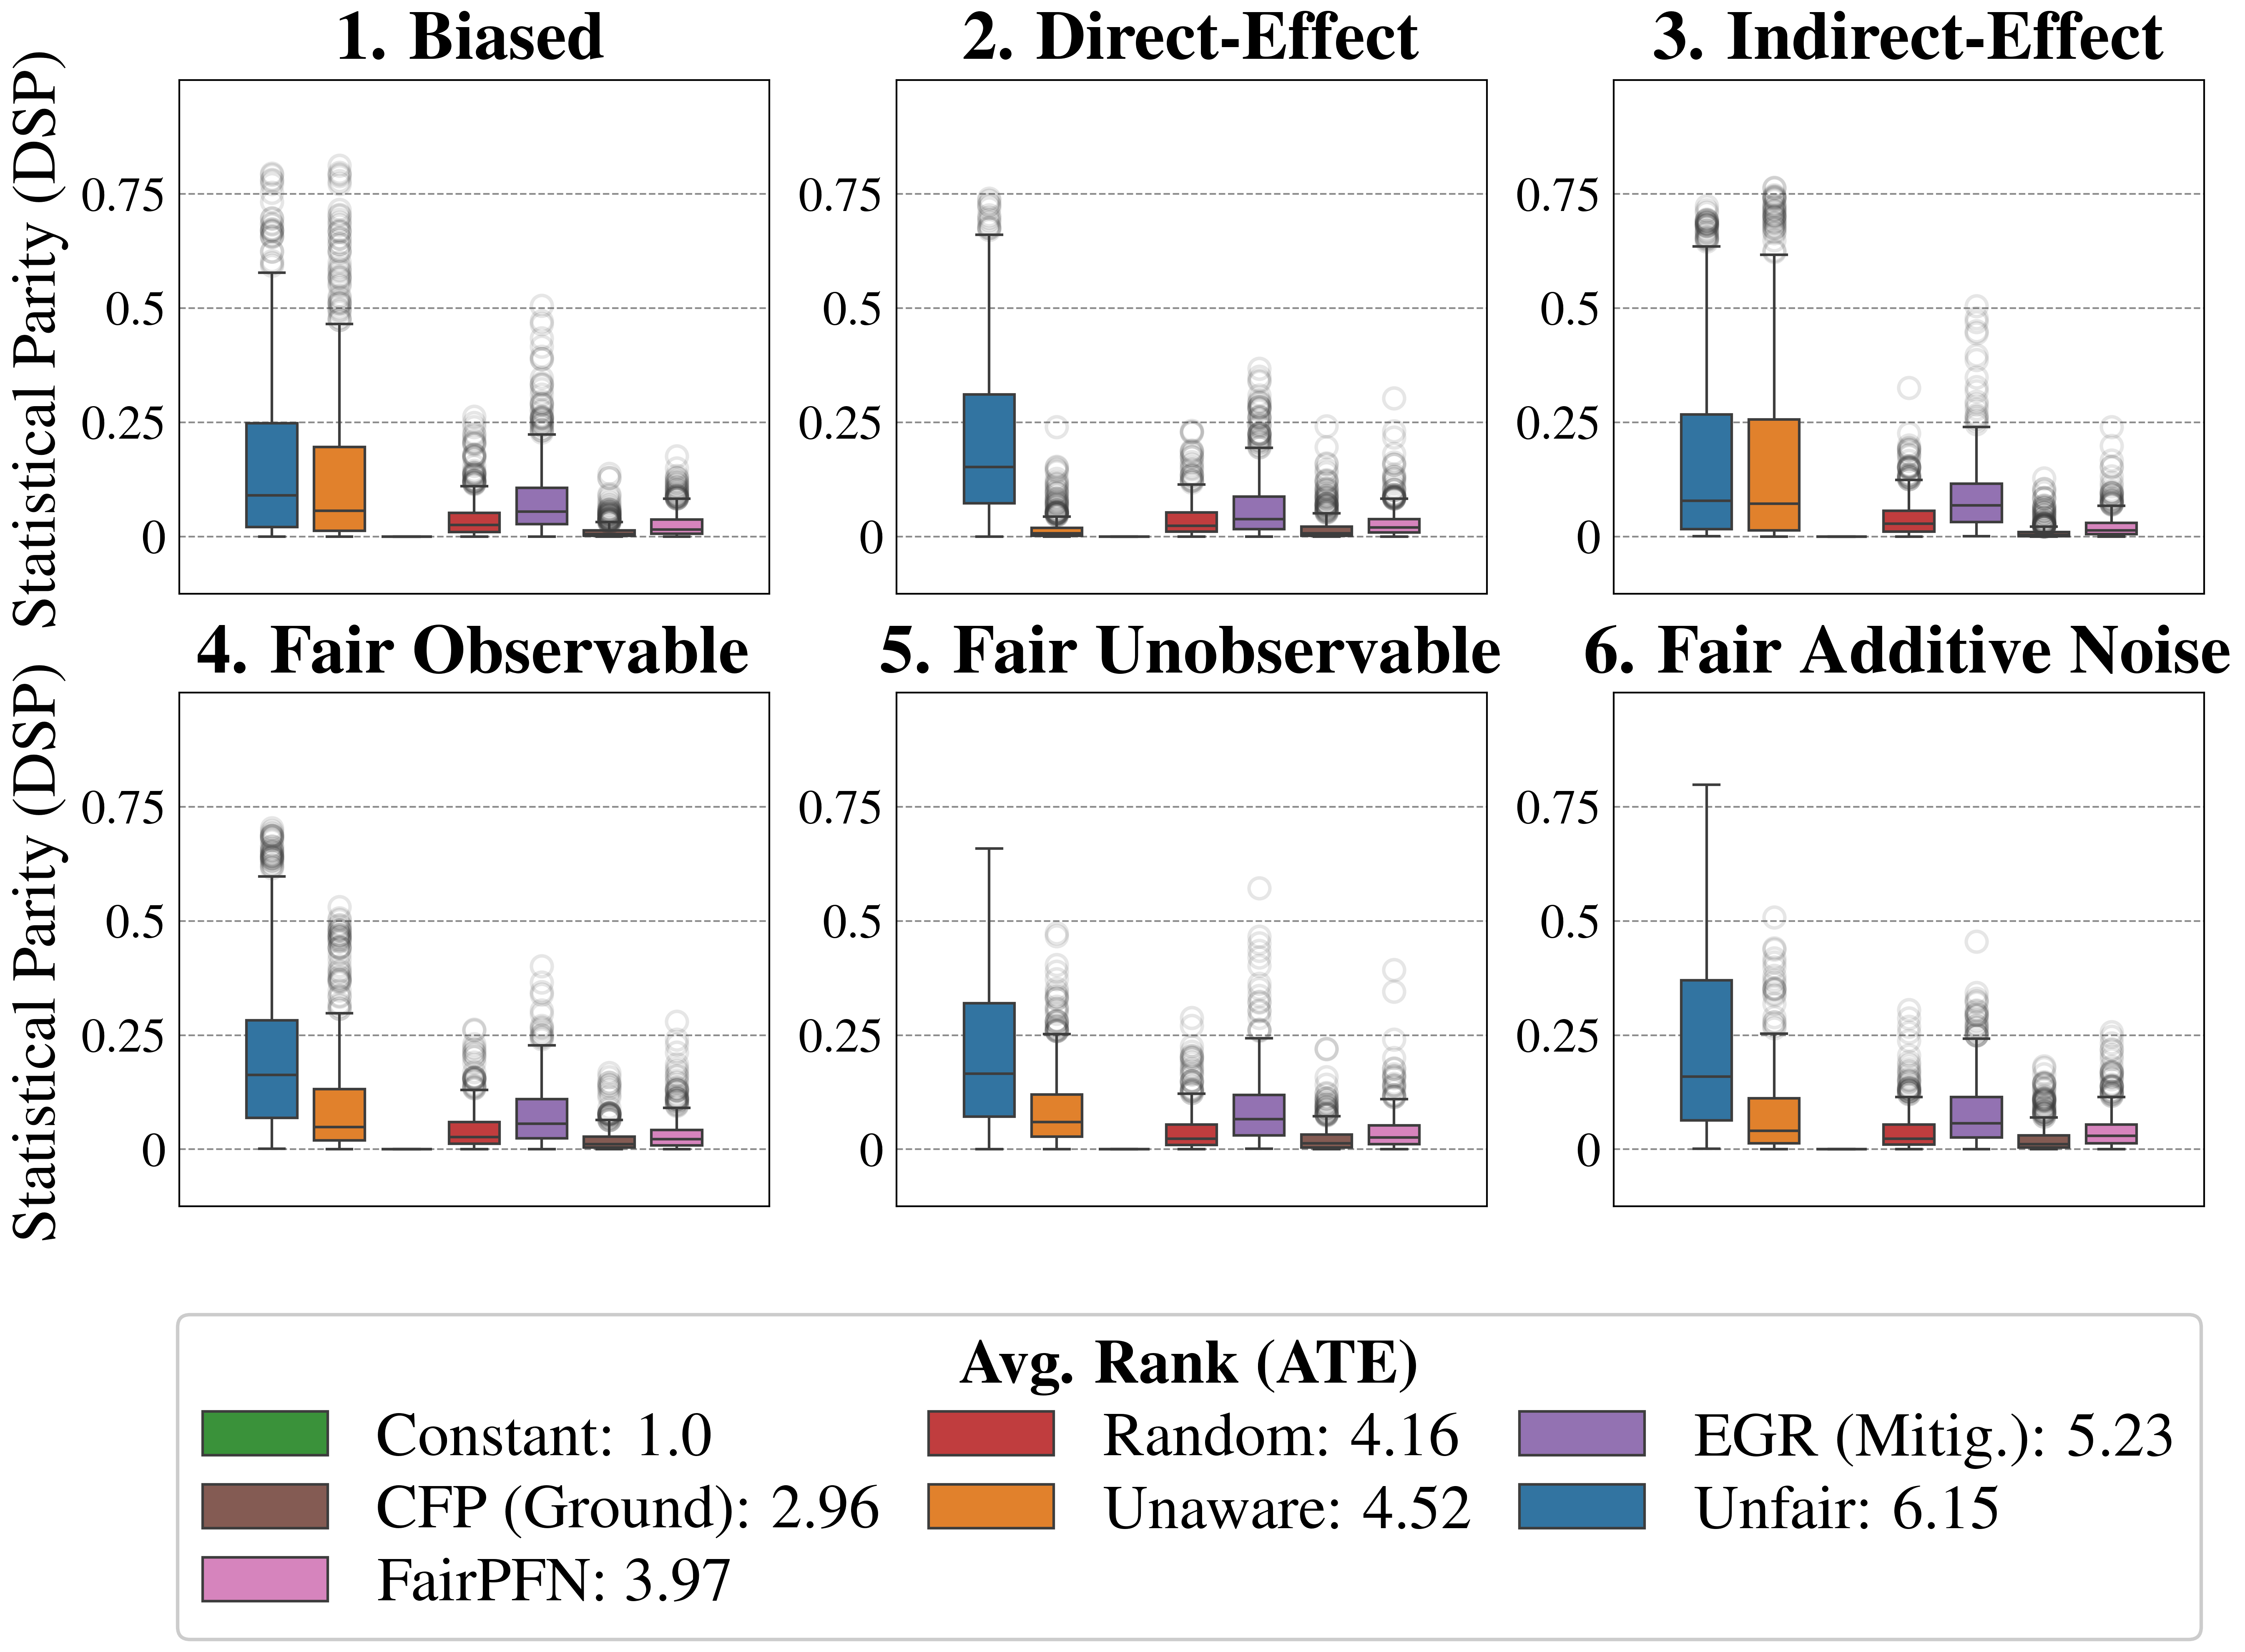
This image displays a 2x3 grid of six box plots, each comparing the performance of seven different methods or models across distinct fairness-related scenarios. The primary metric being measured is "Statistical Parity (DSP)" on the y-axis. A comprehensive legend at the bottom maps colors to method names and provides an "Avg. Rank (ATE)" for each.
### Components/Axes
* **Chart Type:** Multi-panel box plot.
* **Y-Axis (All Panels):** Labeled **"Statistical Parity (DSP)"**. The scale runs from 0 to approximately 0.8, with major grid lines at 0, 0.25, 0.5, and 0.75.
* **Panel Titles (Scenarios):**
1. **Biased** (Top Left)
2. **Direct-Effect** (Top Center)
3. **Indirect-Effect** (Top Right)
4. **Fair Observable** (Bottom Left)
5. **Fair Unobservable** (Bottom Center)
6. **Fair Additive Noise** (Bottom Right)
* **Legend (Bottom of Image):** Contains seven entries, each with a color swatch, method name, and a numerical "Avg. Rank (ATE)".
* **Green:** Constant: 1.0
* **Brown:** CFP (Ground): 2.96
* **Pink:** FairPFN: 3.97
* **Red:** Random: 4.16
* **Orange:** Unaware: 4.52
* **Purple:** EGR (Mitig.): 5.23
* **Blue:** Unfair: 6.15
### Detailed Analysis
The analysis is segmented by scenario (panel). For each, the visual trend and approximate value range for each method's box plot is described. The box represents the interquartile range (IQR), the line inside is the median, whiskers extend to 1.5*IQR, and circles are outliers.
**1. Biased Scenario:**
* **Unfair (Blue):** Highest median (~0.1) and largest spread, with outliers reaching above 0.75.
* **Unaware (Orange):** Second highest median (~0.08), significant spread, outliers up to ~0.8.
* **EGR (Mitig.) (Purple):** Moderate median (~0.05), compact IQR, outliers up to ~0.5.
* **Random (Red), FairPFN (Pink), CFP (Ground) (Brown):** All have very low medians near 0, with small IQRs and outliers generally below 0.25.
* **Constant (Green):** Appears as a flat line at 0, indicating no variance.
**2. Direct-Effect Scenario:**
* **Unfair (Blue):** Dominates with the highest median (~0.15) and a very large spread, outliers near 0.75.
* **EGR (Mitig.) (Purple):** Next highest median (~0.07), with outliers up to ~0.35.
* **Unaware (Orange):** Median drops significantly compared to the "Biased" scenario, now near 0.02.
* **Random (Red), FairPFN (Pink), CFP (Ground) (Brown):** Medians remain very low (~0-0.03), with limited spread.
* **Constant (Green):** Flat line at 0.
**3. Indirect-Effect Scenario:**
* **Unfair (Blue) & Unaware (Orange):** Both show high medians (~0.08) and large spreads, with outliers extending to ~0.75. They are visually similar in this panel.
* **EGR (Mitig.) (Purple):** Median around 0.06, with outliers up to ~0.5.
* **Random (Red), FairPFN (Pink), CFP (Ground) (Brown):** Maintain low medians and spreads.
* **Constant (Green):** Flat line at 0.
**4. Fair Observable Scenario:**
* **Unfair (Blue):** Still the highest median (~0.15) and spread, outliers up to ~0.7.
* **Unaware (Orange):** Median around 0.05, with notable outliers up to ~0.5.
* **EGR (Mitig.) (Purple):** Median ~0.05, similar to Unaware but with a slightly tighter IQR.
* **Random (Red), FairPFN (Pink), CFP (Ground) (Brown):** Consistently low values.
* **Constant (Green):** Flat line at 0.
**5. Fair Unobservable Scenario:**
* **Unfair (Blue):** High median (~0.15) and spread, outliers near 0.7.
* **Unaware (Orange):** Median ~0.05, with outliers up to ~0.5.
* **EGR (Mitig.) (Purple):** Median ~0.06, with a notable outlier near 0.6.
* **Random (Red), FairPFN (Pink), CFP (Ground) (Brown):** Low values.
* **Constant (Green):** Flat line at 0.
**6. Fair Additive Noise Scenario:**
* **Unfair (Blue):** Highest median (~0.15) and largest spread, with the upper whisker reaching ~0.8.
* **Unaware (Orange):** Median ~0.05, with outliers up to ~0.5.
* **EGR (Mitig.) (Purple):** Median ~0.06, with outliers up to ~0.4.
* **Random (Red), FairPFN (Pink), CFP (Ground) (Brown):** Low values.
* **Constant (Green):** Flat line at 0.
### Key Observations
1. **Consistent Hierarchy:** Across all six scenarios, the **Unfair (Blue)** method consistently exhibits the highest median Statistical Parity and the greatest variance (tallest box and whiskers). The **Constant (Green)** method is consistently a flat line at zero.
2. **Scenario Impact on Unaware:** The **Unaware (Orange)** method performs poorly (high DSP) in the "Biased" and "Indirect-Effect" scenarios but shows marked improvement (lower DSP) in the "Direct-Effect" and the three "Fair" scenarios.
3. **Stable Low-Performers:** The **Random (Red)**, **FairPFN (Pink)**, and **CFP (Ground) (Brown)** methods consistently show very low Statistical Parity (medians near zero) across all scenarios, with relatively small interquartile ranges.
4. **EGR (Mitig.) Position:** The **EGR (Mitig.) (Purple)** method generally occupies a middle ground, with higher DSP than the best-performing group but lower than Unfair/Unaware in most cases.
5. **Legend Rank Correlation:** The "Avg. Rank (ATE)" in the legend (where a lower number is better) correlates with the visual performance: Constant (1.0) is best (flat at 0), followed by CFP (2.96), FairPFN (3.97), etc., with Unfair (6.15) being the worst, matching its consistently high DSP values.
### Interpretation
This figure evaluates algorithmic fairness by measuring **Statistical Parity (DSP)**, a metric where a value of 0 indicates perfect parity (no disparity between groups) and higher values indicate greater bias. The six panels represent different data-generating processes or fairness constraints ("Biased", "Direct-Effect", etc.) used to test the methods.
The data suggests that:
* The **"Unfair"** method serves as a baseline for high bias, as expected.
* Methods like **"Constant"**, **"CFP (Ground)"**, and **"FairPFN"** are highly effective at minimizing Statistical Parity across a variety of challenging scenarios, suggesting robust fairness performance.
* The **"Unaware"** method (likely a model trained without sensitive attributes) is not reliably fair; its performance is highly dependent on the underlying data structure, failing badly in "Biased" and "Indirect-Effect" settings.
* The **"EGR (Mitig.)"** method provides a consistent, moderate improvement over the Unaware and Unfair baselines but does not achieve the low parity levels of the top group.
* The **"Avg. Rank (ATE)"** provides a summary metric that aligns well with the visual evidence from the box plots, confirming that methods with lower DSP values in the plots achieve better (lower) average ranks.
In essence, the chart demonstrates that specialized fairness-aware methods (CFP, FairPFN) and even a simple constant predictor can significantly outperform standard or unaware models in achieving statistical parity, but their effectiveness is consistent across different definitions of fairness problems. The "Unaware" approach is shown to be risky and inconsistent.
DECODING INTELLIGENCE...