## Box Plot Chart: Statistical Parity (DSP) Across Different Fairness Scenarios and Methods
### Overview
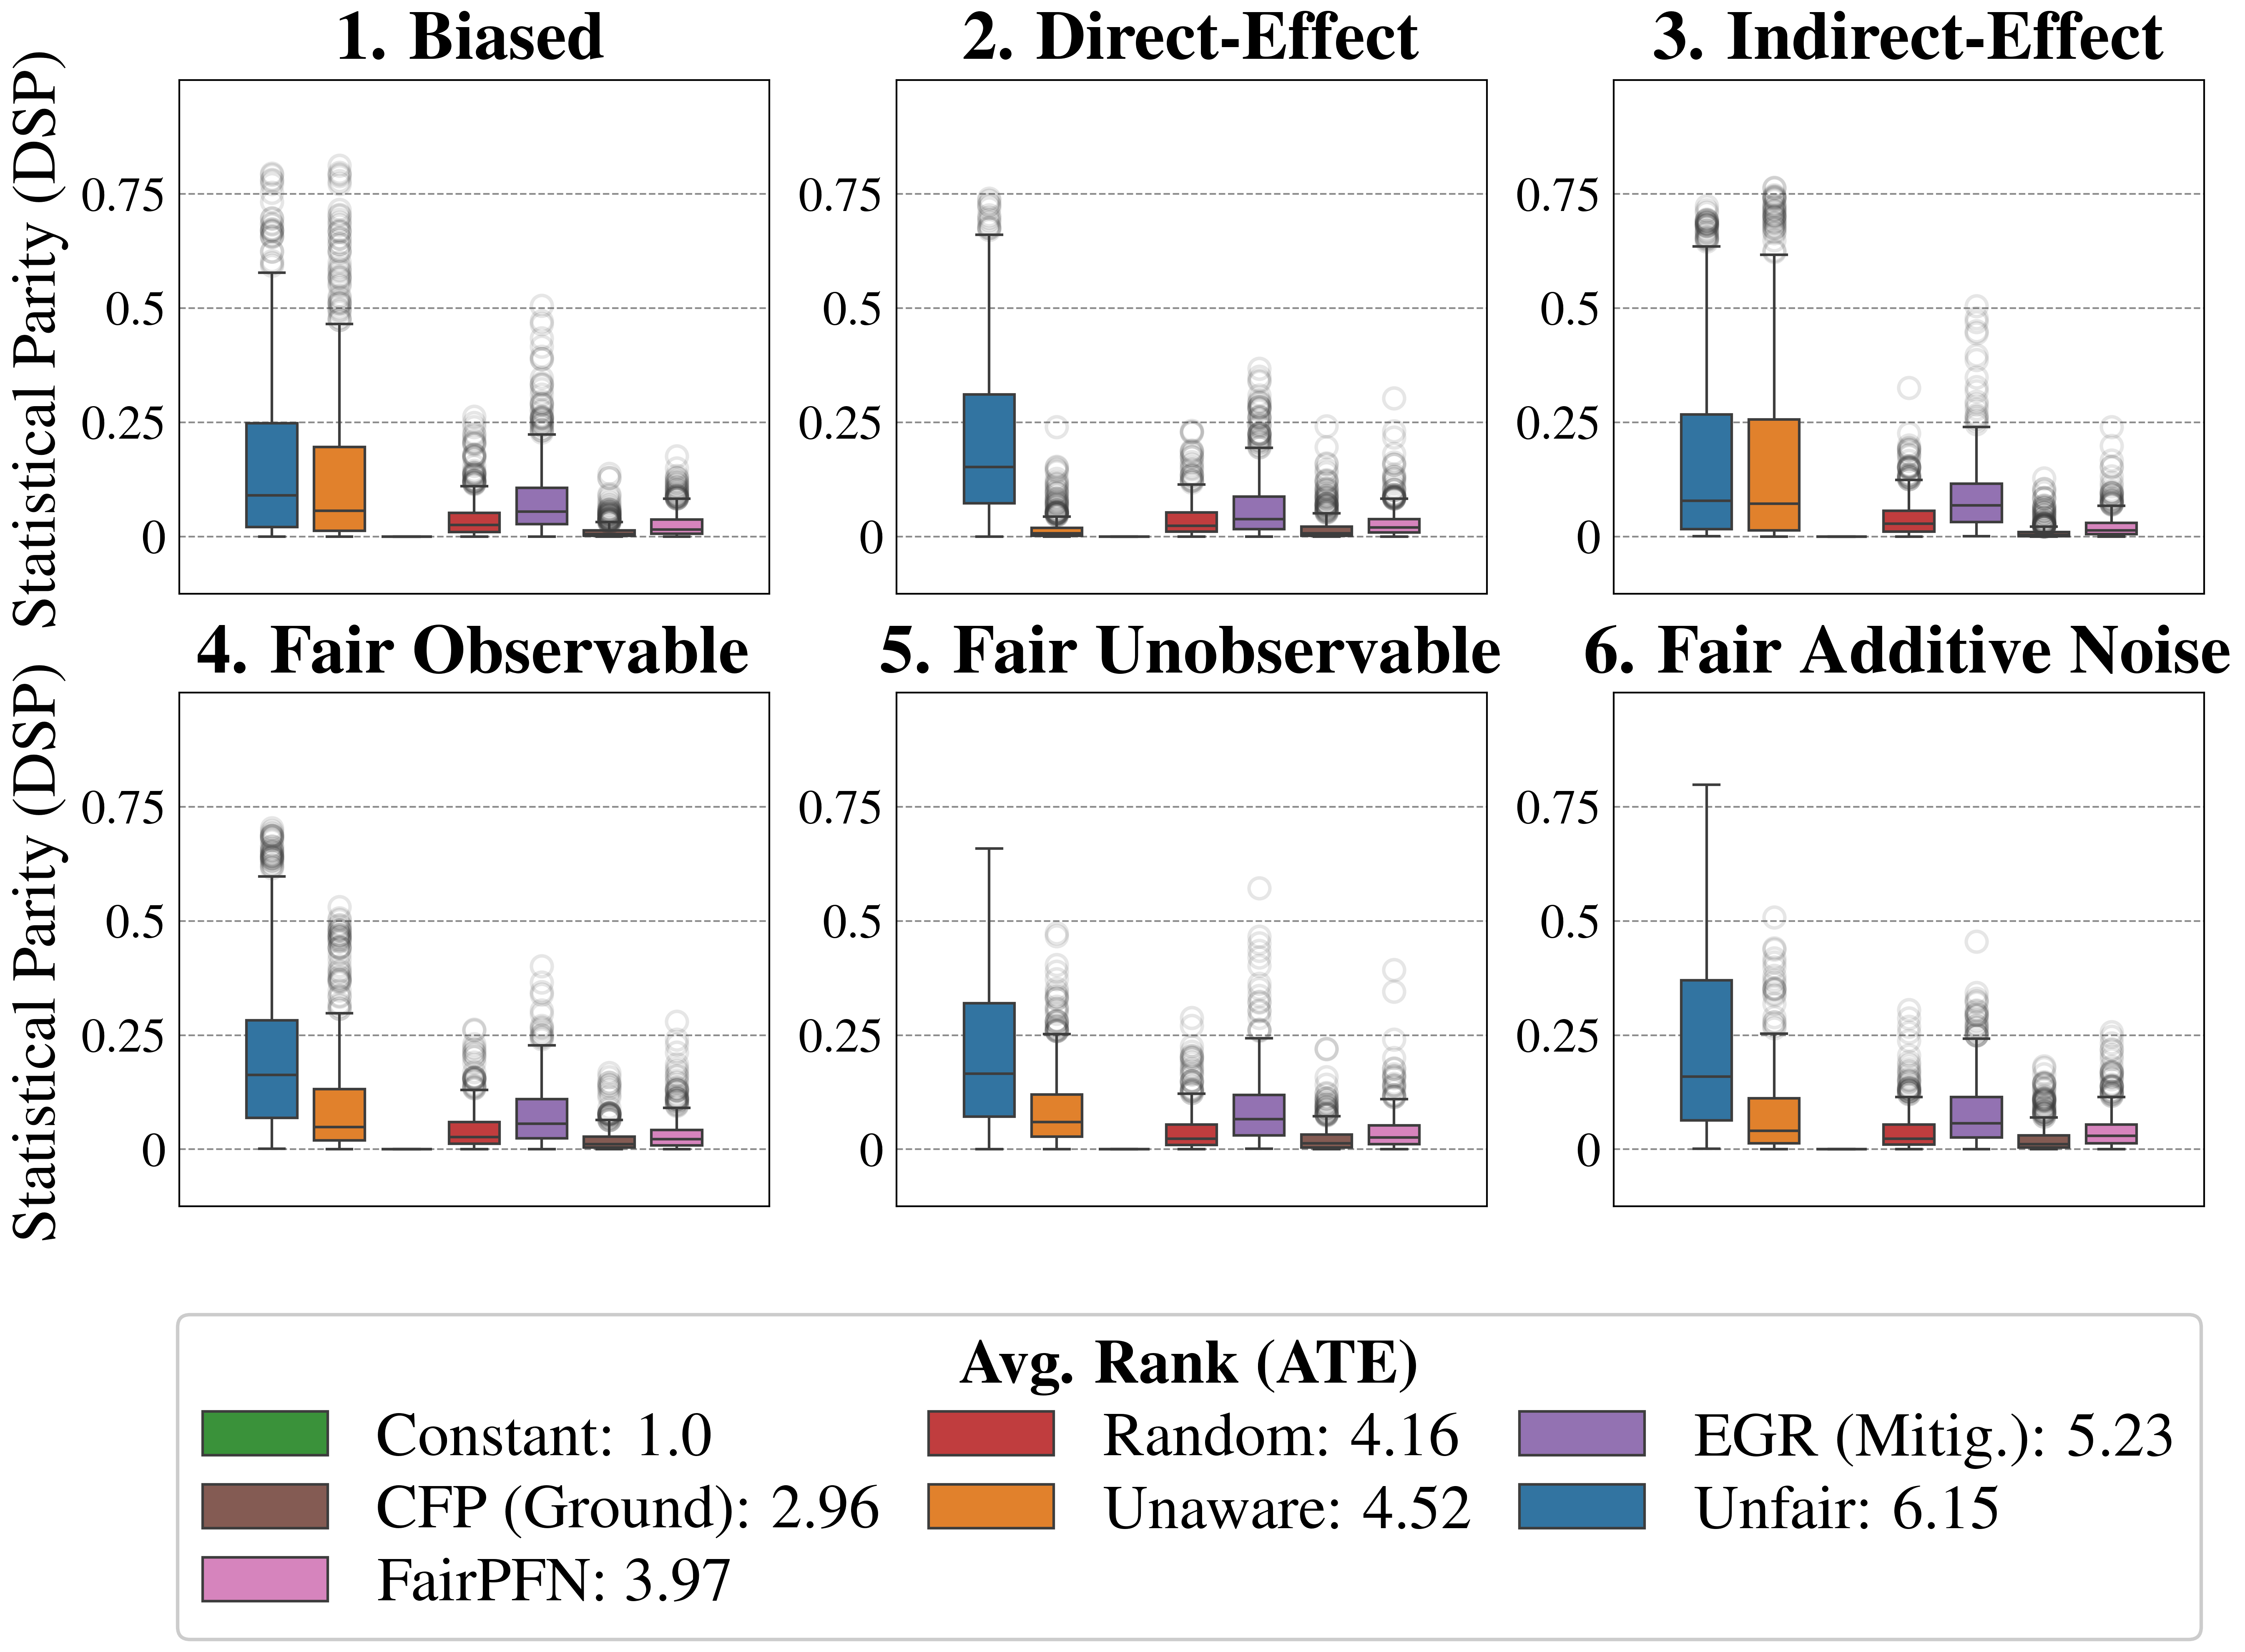
The image presents six box plots comparing statistical parity (DSP) across six fairness scenarios: Biased, Direct-Effect, Indirect-Effect, Fair Observable, Fair Unobservable, and Fair Additive Noise. Each plot evaluates six fairness methods (Constant, CFP, FairPFN, Random, Unaware, Unfair) using colored boxes and outliers. The y-axis ranges from 0 to 0.75, representing statistical parity disparity, while the x-axis lists methods with their average ranks (ATE) in parentheses.
### Components/Axes
- **Y-Axis**: "Statistical Parity (DSP)" (0 to 0.75, linear scale).
- **X-Axis**: Methods labeled with average ranks (ATE):
- Constant: 1.0 (blue)
- CFP (Ground): 2.96 (brown)
- FairPFN: 3.97 (purple)
- Random: 4.16 (red)
- Unaware: 4.52 (orange)
- Unfair: 6.15 (dark blue)
- **Legend**: Located at the bottom, mapping colors to methods and their ATE ranks.
- **Subplot Titles**:
1. Biased
2. Direct-Effect
3. Indirect-Effect
4. Fair Observable
5. Fair Unobservable
6. Fair Additive Noise
### Detailed Analysis
1. **Biased Scenario**:
- **Constant (blue)**: Median ~0.25, range 0–0.5, outliers up to 0.75.
- **CFP (brown)**: Median ~0.15, range 0–0.3, outliers up to 0.4.
- **FairPFN (purple)**: Median ~0.1, range 0–0.25, outliers up to 0.3.
- **Random (red)**: Median ~0.1, range 0–0.2, outliers up to 0.3.
- **Unaware (orange)**: Median ~0.1, range 0–0.2, outliers up to 0.3.
- **Unfair (dark blue)**: Median ~0.1, range 0–0.2, outliers up to 0.3.
2. **Direct-Effect Scenario**:
- **Constant (blue)**: Median ~0.2, range 0–0.4, outliers up to 0.6.
- **CFP (brown)**: Median ~0.1, range 0–0.3, outliers up to 0.4.
- **FairPFN (purple)**: Median ~0.05, range 0–0.2, outliers up to 0.3.
- **Random (red)**: Median ~0.05, range 0–0.2, outliers up to 0.3.
- **Unaware (orange)**: Median ~0.05, range 0–0.2, outliers up to 0.3.
- **Unfair (dark blue)**: Median ~0.05, range 0–0.2, outliers up to 0.3.
3. **Indirect-Effect Scenario**:
- **Constant (blue)**: Median ~0.2, range 0–0.5, outliers up to 0.7.
- **CFP (brown)**: Median ~0.1, range 0–0.3, outliers up to 0.4.
- **FairPFN (purple)**: Median ~0.05, range 0–0.2, outliers up to 0.3.
- **Random (red)**: Median ~0.05, range 0–0.2, outliers up to 0.3.
- **Unaware (orange)**: Median ~0.05, range 0–0.2, outliers up to 0.3.
- **Unfair (dark blue)**: Median ~0.05, range 0–0.2, outliers up to 0.3.
4. **Fair Observable Scenario**:
- **Constant (blue)**: Median ~0.25, range 0–0.5, outliers up to 0.7.
- **CFP (brown)**: Median ~0.15, range 0–0.3, outliers up to 0.4.
- **FairPFN (purple)**: Median ~0.1, range 0–0.25, outliers up to 0.3.
- **Random (red)**: Median ~0.1, range 0–0.2, outliers up to 0.3.
- **Unaware (orange)**: Median ~0.1, range 0–0.2, outliers up to 0.3.
- **Unfair (dark blue)**: Median ~0.1, range 0–0.2, outliers up to 0.3.
5. **Fair Unobservable Scenario**:
- **Constant (blue)**: Median ~0.25, range 0–0.5, outliers up to 0.7.
- **CFP (brown)**: Median ~0.15, range 0–0.3, outliers up to 0.4.
- **FairPFN (purple)**: Median ~0.1, range 0–0.25, outliers up to 0.3.
- **Random (red)**: Median ~0.1, range 0–0.2, outliers up to 0.3.
- **Unaware (orange)**: Median ~0.1, range 0–0.2, outliers up to 0.3.
- **Unfair (dark blue)**: Median ~0.1, range 0–0.2, outliers up to 0.3.
6. **Fair Additive Noise Scenario**:
- **Constant (blue)**: Median ~0.3, range 0–0.6, outliers up to 0.8.
- **CFP (brown)**: Median ~0.2, range 0–0.4, outliers up to 0.5.
- **FairPFN (purple)**: Median ~0.15, range 0–0.3, outliers up to 0.4.
- **Random (red)**: Median ~0.15, range 0–0.3, outliers up to 0.4.
- **Unaware (orange)**: Median ~0.15, range 0–0.3, outliers up to 0.4.
- **Unfair (dark blue)**: Median ~0.15, range 0–0.3, outliers up to 0.4.
### Key Observations
- **FairPFN (purple)** consistently shows the lowest median DSP values across most scenarios, indicating superior statistical parity.
- **Unfair (dark blue)** and **Unaware (orange)** methods exhibit higher median DSP values, suggesting poorer fairness performance.
- **Fair Additive Noise** scenario has the highest DSP values overall, implying greater disparity in this context.
- Outliers in the **Biased** and **Indirect-Effect** scenarios for **Constant** and **CFP** methods suggest occasional extreme disparities.
### Interpretation
The data demonstrates that **FairPFN** is the most effective method for maintaining statistical parity (lowest DSP), while **Unfair** and **Unaware** methods perform worst. The **Fair Additive Noise** scenario introduces the greatest disparity, likely due to noise-induced bias. The average ranks (ATE) align with these trends: **Constant** (1.0) and **CFP** (2.96) rank highest (best), while **Unfair** (6.15) ranks lowest (worst). The box plots reveal that fairness methods with lower ATE ranks (e.g., FairPFN) exhibit tighter interquartile ranges and fewer outliers, indicating more consistent performance. The **Direct-Effect** and **Indirect-Effect** scenarios show similar trends, but **Fair Additive Noise** amplifies disparities, highlighting sensitivity to noise in fairness evaluations.