## Log-Log Chart: Trailing LM Loss vs. PFLOP/s-days
### Overview
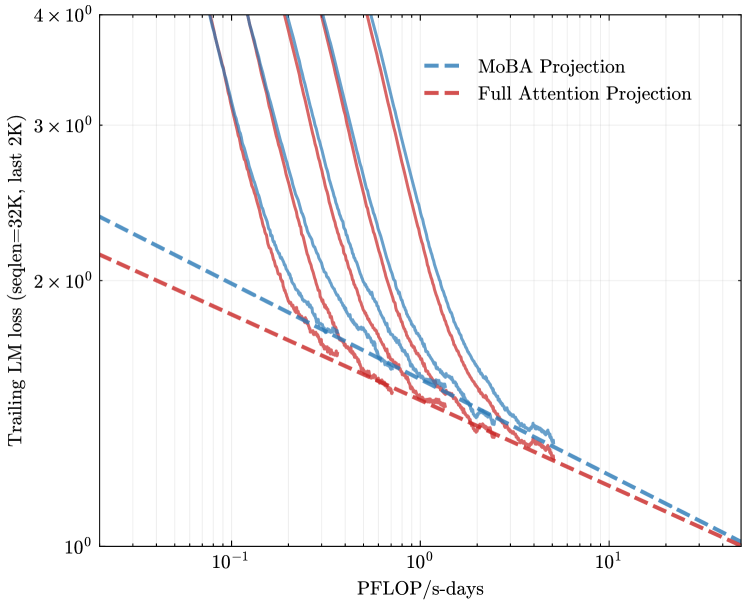
The image is a log-log plot comparing the trailing language model (LM) loss for two different projection methods: MoBA Projection and Full Attention Projection, as a function of PFLOP/s-days. The plot shows multiple curves for each projection method, and also includes dashed lines representing a baseline for each method.
### Components/Axes
* **X-axis:** PFLOP/s-days (log scale), with markers at 10<sup>-1</sup>, 10<sup>0</sup> (1), and 10<sup>1</sup> (10).
* **Y-axis:** Trailing LM loss (seqlen=32K, last 2K) (log scale), with markers at 10<sup>0</sup> (1), 2 x 10<sup>0</sup> (2), 3 x 10<sup>0</sup> (3), and 4 x 10<sup>0</sup> (4).
* **Legend (top-center):**
* Blue dashed line: MoBA Projection
* Red dashed line: Full Attention Projection
### Detailed Analysis
* **MoBA Projection (Blue Dashed Line):** The dashed blue line represents the MoBA projection. It shows a downward trend, starting at approximately (0.05, 2.5) and ending at approximately (20, 1.0).
* **Full Attention Projection (Red Dashed Line):** The dashed red line represents the Full Attention projection. It also shows a downward trend, starting at approximately (0.05, 2.0) and ending at approximately (20, 0.8).
* **MoBA Projection (Solid Blue Lines):** There are multiple solid blue lines, each representing a different run or configuration of the MoBA projection. All solid blue lines show a steep downward trend initially, then flatten out as PFLOP/s-days increases.
* The leftmost blue line starts at approximately (0.05, 40) and decreases to approximately (1, 1.5).
* The rightmost blue line starts at approximately (0.05, 15) and decreases to approximately (1, 1.3).
* **Full Attention Projection (Solid Red Lines):** There are multiple solid red lines, each representing a different run or configuration of the Full Attention projection. All solid red lines show a steep downward trend initially, then flatten out as PFLOP/s-days increases.
* The leftmost red line starts at approximately (0.05, 40) and decreases to approximately (1, 1.3).
* The rightmost red line starts at approximately (0.05, 15) and decreases to approximately (1, 1.2).
### Key Observations
* Both MoBA and Full Attention projections show a decrease in trailing LM loss as PFLOP/s-days increases.
* The solid lines (representing different runs) converge towards a similar loss value as PFLOP/s-days increases.
* The dashed lines (baselines) show a more consistent decrease in loss compared to the solid lines.
* At lower PFLOP/s-days, the solid lines show a much higher loss compared to the dashed lines.
### Interpretation
The plot compares the performance of MoBA and Full Attention projection methods in terms of trailing LM loss as a function of computational resources (PFLOP/s-days). The multiple solid lines for each method likely represent different hyperparameter settings or training runs. The dashed lines probably represent a theoretical or baseline performance.
The data suggests that both methods benefit from increased computational resources, as indicated by the decreasing loss. The convergence of the solid lines suggests that, regardless of initial configuration, the models tend to achieve similar performance levels with sufficient training. The higher initial loss of the solid lines compared to the dashed lines may indicate a need for initial warm-up or optimization before the models reach their full potential. The Full Attention Projection seems to have a slightly lower loss than the MoBA Projection, especially at higher PFLOP/s-days.