## Chart: Training Loss vs. Compute
### Overview
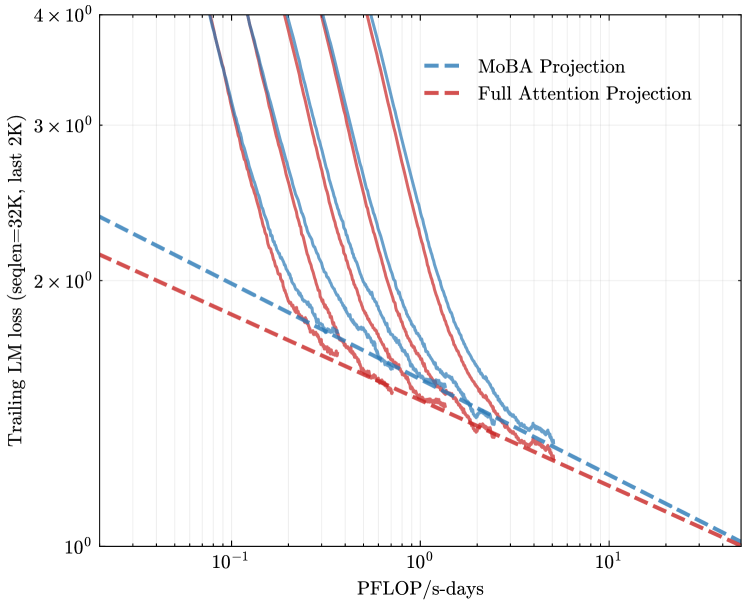
The image presents a line chart comparing the training loss of two different projection methods – MoBA Projection and Full Attention Projection – as a function of compute (PFLOP/s-days). The y-axis represents the trailing LM loss (seqlen=32K, last 2K), and the x-axis represents the compute used for training. Multiple lines are plotted for each projection method, likely representing different training runs or configurations. The chart uses a logarithmic scale for both axes.
### Components/Axes
* **X-axis Title:** PFLOP/s-days
* **Y-axis Title:** Trailing LM loss (seqlen=32K, last 2K)
* **X-axis Scale:** Logarithmic, ranging from 10<sup>-1</sup> to 10<sup>1</sup>. Markers are at 10<sup>-1</sup>, 10<sup>0</sup>, and 10<sup>1</sup>.
* **Y-axis Scale:** Logarithmic, ranging from 10<sup>1</sup> to 10<sup>4</sup>. Markers are at 10<sup>1</sup>, 10<sup>2</sup>, 10<sup>3</sup>, and 10<sup>4</sup>.
* **Legend:** Located in the top-right corner.
* **MoBA Projection:** Represented by a dashed blue line.
* **Full Attention Projection:** Represented by a dashed red line.
### Detailed Analysis
The chart displays multiple lines for each projection method, indicating variability in training runs.
**MoBA Projection (Blue Lines):**
The blue lines generally show a steep downward trend initially, indicating rapid loss reduction with increasing compute. As compute increases, the rate of loss reduction slows down.
* Line 1: Starts at approximately 2.5 x 10<sup>2</sup> loss at 10<sup>-1</sup> PFLOP/s-days, decreasing to approximately 1.2 x 10<sup>1</sup> loss at 10<sup>1</sup> PFLOP/s-days.
* Line 2: Starts at approximately 2.2 x 10<sup>2</sup> loss at 10<sup>-1</sup> PFLOP/s-days, decreasing to approximately 1.1 x 10<sup>1</sup> loss at 10<sup>1</sup> PFLOP/s-days.
* Line 3: Starts at approximately 2.0 x 10<sup>2</sup> loss at 10<sup>-1</sup> PFLOP/s-days, decreasing to approximately 1.0 x 10<sup>1</sup> loss at 10<sup>1</sup> PFLOP/s-days.
* Line 4: Starts at approximately 2.3 x 10<sup>2</sup> loss at 10<sup>-1</sup> PFLOP/s-days, decreasing to approximately 1.1 x 10<sup>1</sup> loss at 10<sup>1</sup> PFLOP/s-days.
**Full Attention Projection (Red Lines):**
The red lines also exhibit a downward trend, but generally start at a lower loss value and have a slightly less steep initial decline compared to the MoBA Projection lines.
* Line 1: Starts at approximately 1.5 x 10<sup>2</sup> loss at 10<sup>-1</sup> PFLOP/s-days, decreasing to approximately 8 x 10<sup>0</sup> loss at 10<sup>1</sup> PFLOP/s-days.
* Line 2: Starts at approximately 1.4 x 10<sup>2</sup> loss at 10<sup>-1</sup> PFLOP/s-days, decreasing to approximately 7 x 10<sup>0</sup> loss at 10<sup>1</sup> PFLOP/s-days.
* Line 3: Starts at approximately 1.3 x 10<sup>2</sup> loss at 10<sup>-1</sup> PFLOP/s-days, decreasing to approximately 6 x 10<sup>0</sup> loss at 10<sup>1</sup> PFLOP/s-days.
* Line 4: Starts at approximately 1.6 x 10<sup>2</sup> loss at 10<sup>-1</sup> PFLOP/s-days, decreasing to approximately 8 x 10<sup>0</sup> loss at 10<sup>1</sup> PFLOP/s-days.
### Key Observations
* The Full Attention Projection consistently achieves lower loss values than the MoBA Projection across the range of compute values.
* There is variability in the training runs for both projection methods, as evidenced by the multiple lines.
* The rate of loss reduction diminishes as compute increases for both methods, suggesting diminishing returns.
* The logarithmic scale compresses the initial rapid loss reduction, making it difficult to discern precise differences in the early stages of training.
### Interpretation
The chart demonstrates the relationship between compute and training loss for two different projection methods. The Full Attention Projection appears to be more efficient in terms of loss reduction per unit of compute, consistently outperforming the MoBA Projection. The multiple lines for each method suggest that the training process is sensitive to initialization or other stochastic factors. The diminishing returns observed at higher compute levels indicate that there is a point beyond which increasing compute yields only marginal improvements in loss. This information is valuable for optimizing training strategies and allocating computational resources effectively. The use of a logarithmic scale is appropriate for visualizing the wide range of loss and compute values, but it also obscures the details of the initial training phase. The "seqlen=32K, last 2K" specification on the y-axis suggests that the loss is being measured on a specific subset of the data, potentially focusing on the later stages of sequence processing.