## Bar Chart: OpenAI RE Interview Coding
### Overview
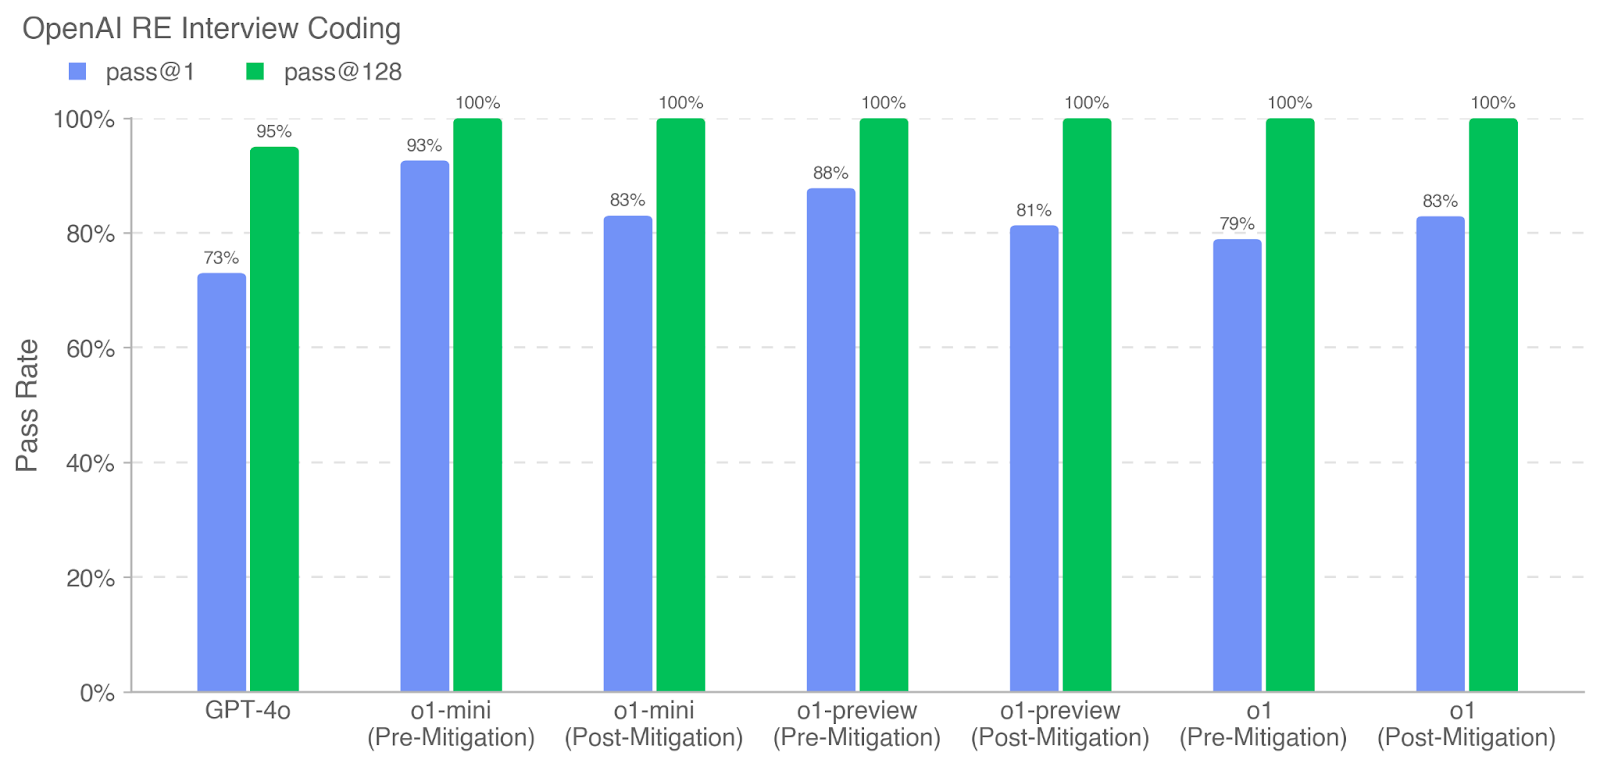
The image is a bar chart comparing the pass rates of different coding models in OpenAI's RE (Research Engineer) interviews. The chart compares the pass rates for "pass@1" (blue bars) and "pass@128" (green bars) across various models, both before and after mitigation strategies were implemented. The y-axis represents the pass rate, ranging from 0% to 100%. The x-axis represents the different models and their pre- and post-mitigation states.
### Components/Axes
* **Title:** OpenAI RE Interview Coding
* **Y-axis:**
* Label: Pass Rate
* Scale: 0%, 20%, 40%, 60%, 80%, 100%
* **X-axis:**
* Categories: GPT-4o, o1-mini (Pre-Mitigation), o1-mini (Post-Mitigation), o1-preview (Pre-Mitigation), o1-preview (Post-Mitigation), o1 (Pre-Mitigation), o1 (Post-Mitigation)
* **Legend:** Located at the top of the chart.
* Blue square: pass@1
* Green square: pass@128
### Detailed Analysis
Here's a breakdown of the pass rates for each model and condition:
* **GPT-4o:**
* pass@1 (blue): 73%
* pass@128 (green): 95%
* **o1-mini (Pre-Mitigation):**
* pass@1 (blue): 93%
* pass@128 (green): 100%
* **o1-mini (Post-Mitigation):**
* pass@1 (blue): 83%
* pass@128 (green): 100%
* **o1-preview (Pre-Mitigation):**
* pass@1 (blue): 88%
* pass@128 (green): 100%
* **o1-preview (Post-Mitigation):**
* pass@1 (blue): 81%
* pass@128 (green): 100%
* **o1 (Pre-Mitigation):**
* pass@1 (blue): 79%
* pass@128 (green): 100%
* **o1 (Post-Mitigation):**
* pass@1 (blue): 83%
* pass@128 (green): 100%
### Key Observations
* The "pass@128" consistently has a higher pass rate than "pass@1" across all models and conditions.
* The "pass@128" rate is at 100% for all models except GPT-4o.
* Mitigation strategies appear to have a mixed impact on "pass@1" rates, with some models showing an increase and others a decrease.
* GPT-4o has the lowest "pass@1" and "pass@128" rates compared to the other models.
### Interpretation
The data suggests that the "pass@128" setting is significantly more effective than "pass@1" in the OpenAI RE interview coding tasks, achieving perfect scores for most models. The mitigation strategies implemented have varying effects on the "pass@1" rates, indicating that their effectiveness may depend on the specific model. The GPT-4o model seems to perform less effectively in this context compared to the other models, suggesting potential areas for improvement or optimization. The consistent 100% pass rate for "pass@128" after mitigation for most models indicates a high level of proficiency in the coding tasks.