## Bar Chart: Accuracy of AI Models on a Specific Task
### Overview
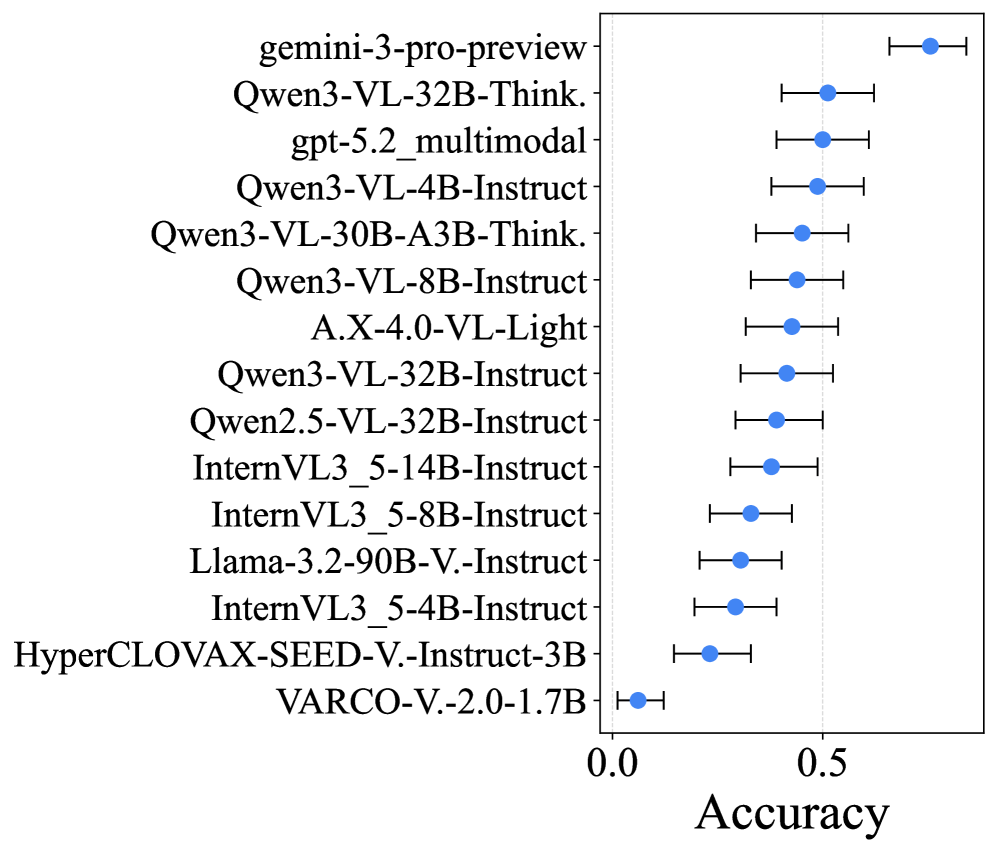
The chart compares the accuracy of various AI models on a specific task, represented by blue data points with error bars. The x-axis measures accuracy (0.0–0.8), while the y-axis lists model names. Error bars indicate variability in performance.
### Components/Axes
- **X-axis**: "Accuracy" (0.0–0.8, linear scale).
- **Y-axis**: Model names (listed top-to-bottom).
- **Data Points**: Blue dots with error bars (horizontal lines indicating confidence intervals).
- **Legend**: Not explicitly visible, but all data points use blue.
### Detailed Analysis
1. **Model Names and Accuracy**:
- **Gemini-3-pro-preview**: ~0.75 (highest accuracy, error bar ±0.03).
- **Qwen3-VL-32B-Think.**: ~0.65 (±0.04).
- **gpt-5.2_multimodal**: ~0.63 (±0.05).
- **Qwen3-VL-4B-Instruct**: ~0.62 (±0.04).
- **Qwen3-VL-30B-A3B-Think.**: ~0.60 (±0.05).
- **Qwen3-VL-8B-Instruct**: ~0.58 (±0.04).
- **A.X-4.0-VL-Light**: ~0.55 (±0.06).
- **Qwen3-VL-32B-Instruct**: ~0.53 (±0.05).
- **Qwen2.5-VL-32B-Instruct**: ~0.50 (±0.06).
- **InternVL3_5-14B-Instruct**: ~0.48 (±0.05).
- **InternVL3_5-8B-Instruct**: ~0.45 (±0.06).
- **Llama-3-2-90B-V.-Instruct**: ~0.42 (±0.05).
- **InternVL3_5-4B-Instruct**: ~0.40 (±0.06).
- **HyperCLOVAX-SEED-V.-Instruct-3B**: ~0.35 (±0.07).
- **VARCO-V.2.0-1.7B**: ~0.15 (±0.04).
2. **Error Bars**:
- Larger error bars correlate with lower accuracy (e.g., VARCO-V.2.0-1.7B has the smallest error bar but lowest accuracy).
- Mid-range models (e.g., Qwen3-VL-32B-Think.) show moderate error bars (±0.04–0.05).
### Key Observations
- **Highest Performance**: Gemini-3-pro-preview dominates with ~0.75 accuracy.
- **Clustered Mid-Range**: Qwen3 models (32B, 4B, 8B) cluster between 0.58–0.65 accuracy.
- **Decline in Smaller Models**: Models like HyperCLOVAX-SEED-V.-Instruct-3B and VARCO-V.2.0-1.7B show significant drops in accuracy.
- **Error Bar Variability**: Larger models (e.g., Gemini, Qwen3) have tighter confidence intervals, suggesting more consistent performance.
### Interpretation
The chart demonstrates a clear trend where larger, more specialized models (e.g., Gemini, Qwen3) achieve higher accuracy, while smaller or less optimized models (e.g., VARCO) perform poorly. Error bars highlight that performance consistency varies inversely with model size. Notably, some models with similar parameter counts (e.g., Qwen3-VL-32B-Think. vs. Qwen3-VL-32B-Instruct) show divergent accuracies, suggesting architectural or training differences matter beyond scale. The data underscores the importance of model design and specialization for task-specific performance.