## Scatter Plot: Task Success Rate vs. Quality/Controllability
### Overview
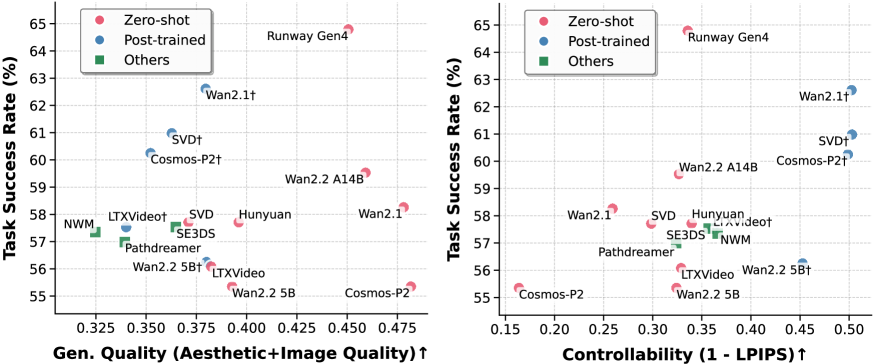
The image contains two scatter plots comparing the Task Success Rate (%) of different models against two different metrics: General Quality (Aesthetic+Image Quality) and Controllability (1 - LPIPS). The plots show the performance of Zero-shot, Post-trained, and Other models.
### Components/Axes
**Left Scatter Plot:**
* **Title:** Implicitly "Task Success Rate vs. General Quality"
* **Y-axis:** Task Success Rate (%), ranging from 55% to 65% with gridlines at each percentage point.
* **X-axis:** Gen. Quality (Aesthetic+Image Quality) ↑, ranging from approximately 0.325 to 0.475, with gridlines at intervals of 0.025. The upward arrow indicates that higher values are better.
* **Legend (Top-Left):**
* Red circle: Zero-shot
* Blue circle: Post-trained
* Green square: Others
**Right Scatter Plot:**
* **Title:** Implicitly "Task Success Rate vs. Controllability"
* **Y-axis:** Task Success Rate (%), ranging from 55% to 65% with gridlines at each percentage point.
* **X-axis:** Controllability (1 - LPIPS) ↑, ranging from approximately 0.15 to 0.50, with gridlines at intervals of 0.05. The upward arrow indicates that higher values are better.
* **Legend (Top-Left):**
* Red circle: Zero-shot
* Blue circle: Post-trained
* Green square: Others
### Detailed Analysis
**Left Scatter Plot (Task Success Rate vs. General Quality):**
* **Zero-shot (Red):**
* Runway Gen4: Task Success Rate ~64.8%, Gen. Quality ~0.47
* Wan2.1: Task Success Rate ~58.2%, Gen. Quality ~0.46
* Wan2.2 A14B: Task Success Rate ~59.5%, Gen. Quality ~0.43
* Hunyuan: Task Success Rate ~58%, Gen. Quality ~0.40
* SVD: Task Success Rate ~58%, Gen. Quality ~0.37
* LTXVideo: Task Success Rate ~56%, Gen. Quality ~0.36
* Wan2.2 5B: Task Success Rate ~55.8%, Gen. Quality ~0.41
* Cosmos-P2: Task Success Rate ~55.5%, Gen. Quality ~0.47
* **Post-trained (Blue):**
* Wan2.1†: Task Success Rate ~62.5%, Gen. Quality ~0.39
* SVD†: Task Success Rate ~60.8%, Gen. Quality ~0.36
* Cosmos-P2†: Task Success Rate ~60.2%, Gen. Quality ~0.36
* LTXVideot: Task Success Rate ~57.5%, Gen. Quality ~0.35
* Wan2.2 5B†: Task Success Rate ~56.2%, Gen. Quality ~0.39
* **Others (Green):**
* NWM: Task Success Rate ~57.3%, Gen. Quality ~0.32
* SE3DS: Task Success Rate ~57.2%, Gen. Quality ~0.36
* Pathdreamer: Task Success Rate ~57%, Gen. Quality ~0.35
**Right Scatter Plot (Task Success Rate vs. Controllability):**
* **Zero-shot (Red):**
* Runway Gen4: Task Success Rate ~64.8%, Controllability ~0.32
* Wan2.2 A14B: Task Success Rate ~59.5%, Controllability ~0.28
* Wan2.1: Task Success Rate ~58.2%, Controllability ~0.23
* Hunyuan: Task Success Rate ~58%, Controllability ~0.34
* SVD: Task Success Rate ~58%, Controllability ~0.32
* Cosmos-P2: Task Success Rate ~55.5%, Controllability ~0.17
* Wan2.2 5B: Task Success Rate ~55.8%, Controllability ~0.37
* **Post-trained (Blue):**
* Wan2.1†: Task Success Rate ~62.5%, Controllability ~0.45
* SVD†: Task Success Rate ~60.8%, Controllability ~0.48
* Cosmos-P2†: Task Success Rate ~60.2%, Controllability ~0.46
* Wan2.2 5B†: Task Success Rate ~56.2%, Controllability ~0.40
* LTXVideot: Task Success Rate ~57.5%, Controllability ~0.38
* **Others (Green):**
* NWM: Task Success Rate ~57.3%, Controllability ~0.35
* SE3DS: Task Success Rate ~57.2%, Controllability ~0.33
* Pathdreamer: Task Success Rate ~57%, Controllability ~0.28
### Key Observations
* Runway Gen4 (Zero-shot) achieves the highest Task Success Rate in both plots, but its Controllability is relatively low.
* Post-trained models (Wan2.1†, SVD†, Cosmos-P2†) generally show a good balance between Task Success Rate and both General Quality and Controllability.
* The "Others" category models (NWM, SE3DS, Pathdreamer) tend to cluster in the lower-left region of both plots, indicating lower performance in both Task Success Rate and the respective quality metrics.
* There is a positive correlation between Task Success Rate and both General Quality and Controllability, although the relationship is not strictly linear.
### Interpretation
The scatter plots provide a comparative analysis of different models based on their Task Success Rate, General Quality, and Controllability. The data suggests that post-training can improve the performance of models in terms of both Task Success Rate and the quality metrics. However, there is a trade-off between General Quality and Controllability for some models. For example, Runway Gen4 excels in Task Success Rate but has relatively low Controllability. The plots highlight the importance of considering multiple metrics when evaluating the performance of models, as optimizing for one metric may come at the expense of others. The "Others" category models appear to be less effective compared to the Zero-shot and Post-trained models based on these metrics.