## Scatter Plot Grid: Stellar Magnitude vs. Color Index
### Overview
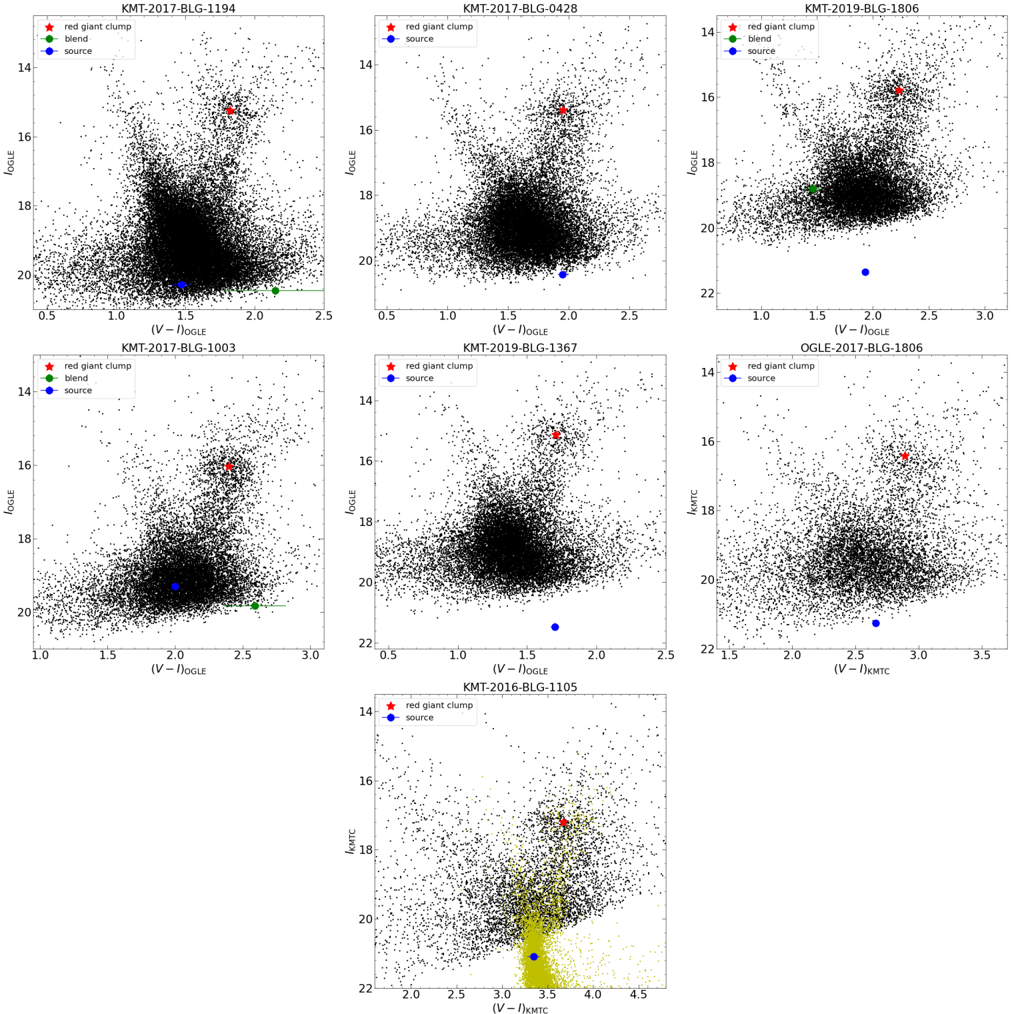
The image presents a grid of seven scatter plots. Each plot displays the relationship between stellar magnitude (I band) and color index (V-I) for different fields of view, likely targeting the Galactic bulge. The plots are titled with identifiers such as "KMT-2017-BLG-1194" and "OGLE-2017-BLG-1806". Each plot highlights the location of the red giant clump and a specific source.
### Components/Axes
* **Titles:** Each plot has a title indicating the field of view, e.g., "KMT-2017-BLG-1194".
* **X-axis:** Represents the color index (V-I). The label is "(V-I)OGLE" for most plots, but "(V-I)KMTC" for the bottom two plots on the right.
* **Y-axis:** Represents the I-band magnitude. The label is "IOGLE" for most plots, but "IKMTC" for the bottom two plots on the right.
* **X-axis Scale:** Varies slightly between plots, but generally ranges from approximately 0.5 to 3.5.
* **Y-axis Scale:** Ranges from approximately 14 to 22.
* **Data Points:** Each plot contains a dense scatter of black points, representing individual stars.
* **Red Giant Clump Marker:** A red star marks the location of the red giant clump in each plot.
* **Source Marker:** A blue circle marks the location of a specific source in each plot.
* **Blend Marker:** Some plots contain a green circle, labeled as "blend".
* **Legend:** Located in the top-left corner of some plots, explaining the markers: red star for "red giant clump", green circle for "blend", and blue circle for "source".
### Detailed Analysis
**Plot 1: KMT-2017-BLG-1194**
* X-axis: (V-I)OGLE, ranging from 0.5 to 2.5
* Y-axis: IOGLE, ranging from 14 to 20
* Red Giant Clump: Located at approximately (1.7, 14.5)
* Source: Located at approximately (1.8, 20)
* Blend: Located at approximately (2.2, 20)
* Trend: The stellar density increases towards lower magnitudes and a color index around 1.
**Plot 2: KMT-2017-BLG-0428**
* X-axis: (V-I)OGLE, ranging from 0.5 to 2.5
* Y-axis: IOGLE, ranging from 14 to 20
* Red Giant Clump: Located at approximately (1.7, 14.5)
* Source: Located at approximately (1.9, 20.2)
* Trend: The stellar density increases towards lower magnitudes and a color index around 1.
**Plot 3: KMT-2019-BLG-1806**
* X-axis: (V-I)OGLE, ranging from 1.0 to 3.0
* Y-axis: IOGLE, ranging from 14 to 22
* Red Giant Clump: Located at approximately (1.7, 14.5)
* Source: Located at approximately (2.0, 21)
* Blend: Located at approximately (1.2, 18.5)
* Trend: The stellar density increases towards lower magnitudes and a color index around 1.5.
**Plot 4: KMT-2017-BLG-1003**
* X-axis: (V-I)OGLE, ranging from 1.0 to 3.0
* Y-axis: IOGLE, ranging from 14 to 22
* Red Giant Clump: Located at approximately (2.3, 16)
* Source: Located at approximately (2.2, 19.5)
* Blend: Located at approximately (2.7, 20)
* Trend: The stellar density increases towards lower magnitudes and a color index around 2.
**Plot 5: KMT-2019-BLG-1367**
* X-axis: (V-I)OGLE, ranging from 1.0 to 2.5
* Y-axis: IOGLE, ranging from 14 to 22
* Red Giant Clump: Located at approximately (1.7, 16)
* Source: Located at approximately (1.8, 20.5)
* Trend: The stellar density increases towards lower magnitudes and a color index around 1.5.
**Plot 6: OGLE-2017-BLG-1806**
* X-axis: (V-I)KMTC, ranging from 1.5 to 3.5
* Y-axis: IKMTC, ranging from 14 to 22
* Red Giant Clump: Located at approximately (2.3, 15)
* Source: Located at approximately (2.5, 20.5)
* Trend: The stellar density increases towards lower magnitudes and a color index around 2.
**Plot 7: KMT-2016-BLG-1105**
* X-axis: (V-I)KMTC, ranging from 2.0 to 4.5
* Y-axis: IKMTC, ranging from 14 to 22
* Red Giant Clump: Located at approximately (3.5, 16)
* Source: Located at approximately (3.4, 21)
* Trend: The stellar density increases towards lower magnitudes and a color index around 3. The stellar distribution is more elongated and vertical compared to other plots. There is a distinct yellow-ish concentration of stars.
### Key Observations
* The red giant clump is consistently located around I ~ 14-16 magnitude.
* The source locations vary across the plots, but are generally fainter (higher magnitude) than the red giant clump.
* The stellar density is highest in regions corresponding to the main sequence and red giant branch.
* The color index (V-I) values for the densest regions vary slightly between plots, possibly due to differences in extinction or stellar populations.
* The bottom two plots use KMTC filters, while the others use OGLE filters.
* Plot KMT-2016-BLG-1105 shows a distinct vertical feature, possibly indicating a specific stellar population or an artifact.
### Interpretation
The plots are color-magnitude diagrams (CMDs) used in stellar population studies. The red giant clump serves as a standard candle, allowing for distance estimation and comparison of stellar populations across different fields of view. The variations in stellar density and color index distribution suggest differences in extinction, metallicity, or age of the stellar populations in each field. The source markers likely indicate specific stars of interest for further study. The difference between OGLE and KMTC filters could be due to different telescope facilities or filter systems, requiring careful calibration when comparing data. The vertical feature in KMT-2016-BLG-1105 warrants further investigation to determine its origin and significance.