\n
## Scatter Plots: Microlensing Event Color-Magnitude Diagrams
### Overview
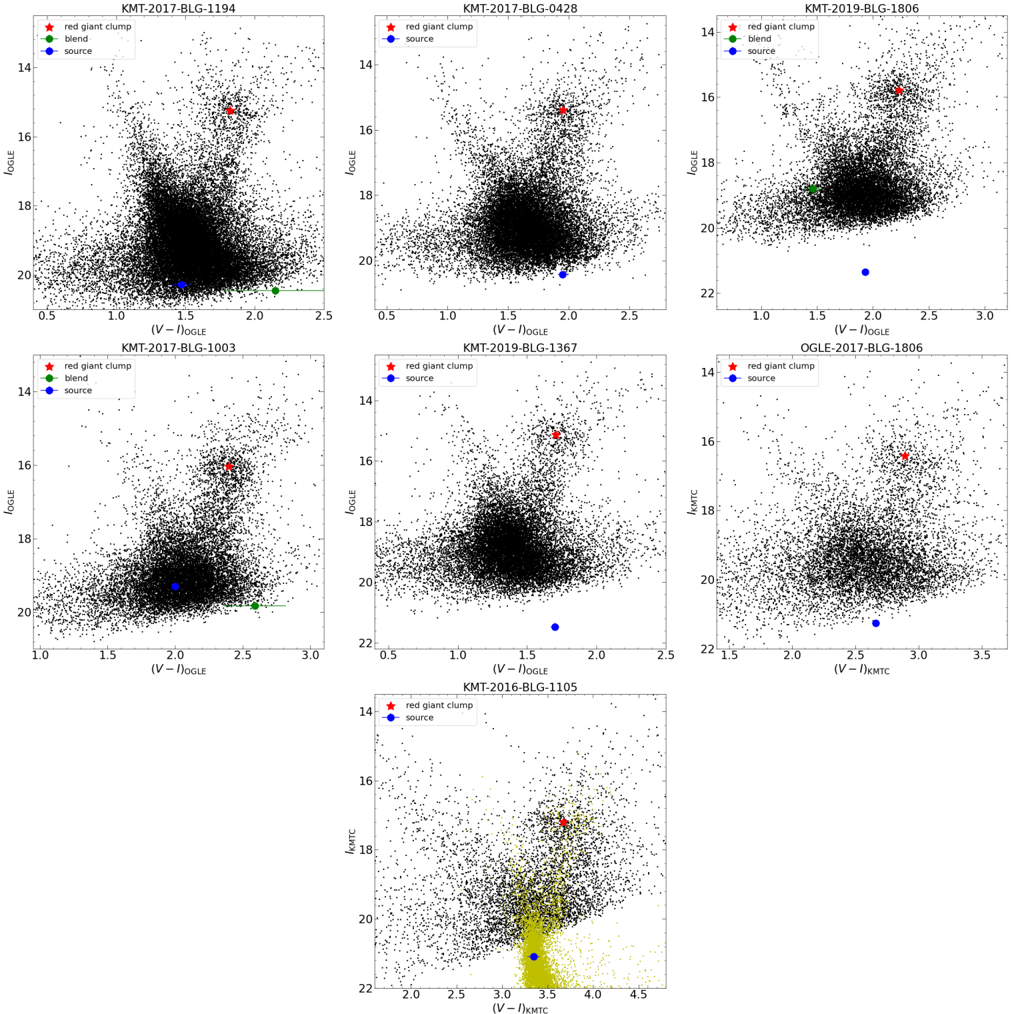
The image contains nine separate scatter plots, each representing a color-magnitude diagram for a microlensing event. Each plot displays the relationship between two color indices (V-I or V-IOGLE, V-K) and magnitude (IOGLE or IkmTc). The plots are arranged in a 3x3 grid. Each plot includes data points representing stars, with different symbols indicating the "red giant clump", "blend", and "source" stars.
### Components/Axes
Each plot shares the following components:
* **X-axis:** Color index (V-I, V-IOGLE, or V-K). Scales range approximately from 0.5 to 4.5, depending on the plot.
* **Y-axis:** Magnitude (IOGLE or IkmTc). Scales range approximately from 14 to 22, depending on the plot.
* **Title:** Identifies the microlensing event (e.g., "KMT-2017-BLG-1194").
* **Legend:** Located in the top-left corner of each plot, defining the symbols used for "red giant clump" (red star), "blend" (green triangle), and "source" (purple circle).
The specific plots and their titles are:
1. KMT-2017-BLG-1194
2. KMT-2017-BLG-0428
3. KMT-2019-BLG-1806
4. KMT-2017-BLG-1003
5. KMT-2019-BLG-1367
6. OGLE-2017-BLG-1806
7. KMT-2017-BLG-0206
8. KMT-2016-BLG-1105
9. KMT-2017-BLG-393
### Detailed Analysis or Content Details
Each plot shows a concentration of points representing stars, forming a general trend. The "red giant clump" stars appear as a distinct concentration, while "blend" and "source" stars are often highlighted with individual markers.
Here's a breakdown of the approximate data points for each plot, focusing on the highlighted "source" stars (purple circles):
1. **KMT-2017-BLG-1194:** Source star at approximately (V-I = 1.8, IOGLE = 16.5).
2. **KMT-2017-BLG-0428:** Source star at approximately (V-IOGLE = 1.9, IOGLE = 17.5).
3. **KMT-2019-BLG-1806:** Source star at approximately (V-I = 2.8, IOGLE = 18.5).
4. **KMT-2017-BLG-1003:** Source star at approximately (V-IOGLE = 2.2, IOGLE = 17.0).
5. **KMT-2019-BLG-1367:** Source star at approximately (V-IOGLE = 1.7, IOGLE = 18.0).
6. **OGLE-2017-BLG-1806:** Source star at approximately (V-K = 3.1, IkmTc = 16.0).
7. **KMT-2017-BLG-0206:** No clear source star is visible.
8. **KMT-2016-BLG-1105:** Source star at approximately (V-K = 3.8, IkmTc = 16.5).
9. **KMT-2017-BLG-393:** Source star at approximately (V-K = 3.9, IkmTc = 17.0).
The "blend" stars (green triangles) are scattered across the plots, generally at lower magnitudes than the "red giant clump" stars. The "red giant clump" stars (red stars) form a relatively tight cluster in each plot.
### Key Observations
* The source stars are consistently highlighted, suggesting they are the primary objects of interest in these microlensing events.
* The color-magnitude relationships vary slightly between the different events, as indicated by the different positions of the star clusters.
* The plots demonstrate a clear separation between the red giant clump, blend, and source stars based on their color and magnitude.
* The data points are densely packed, indicating a large number of stars observed in each field.
### Interpretation
These color-magnitude diagrams are used to study microlensing events, which occur when a massive object (like a star or black hole) passes between Earth and a distant star, magnifying the light from the distant star. The different star populations ("red giant clump", "blend", "source") are identified based on their color and magnitude, allowing astronomers to model the microlensing event and infer properties of the lensing object.
The variations in the diagrams likely reflect differences in the line of sight, the distance to the stars, and the composition of the stellar populations in each field. The highlighted "source" stars represent the stars being lensed, and their positions in the diagrams provide information about their intrinsic properties. The "blend" stars are stars that lie along the line of sight to the source star and contribute to the observed light, while the "red giant clump" stars are a common population of stars in the Milky Way.
The consistent use of color-magnitude diagrams across these events suggests a standardized approach to analyzing microlensing data. The plots provide a visual representation of the data, allowing astronomers to identify and characterize the different star populations and model the microlensing event.