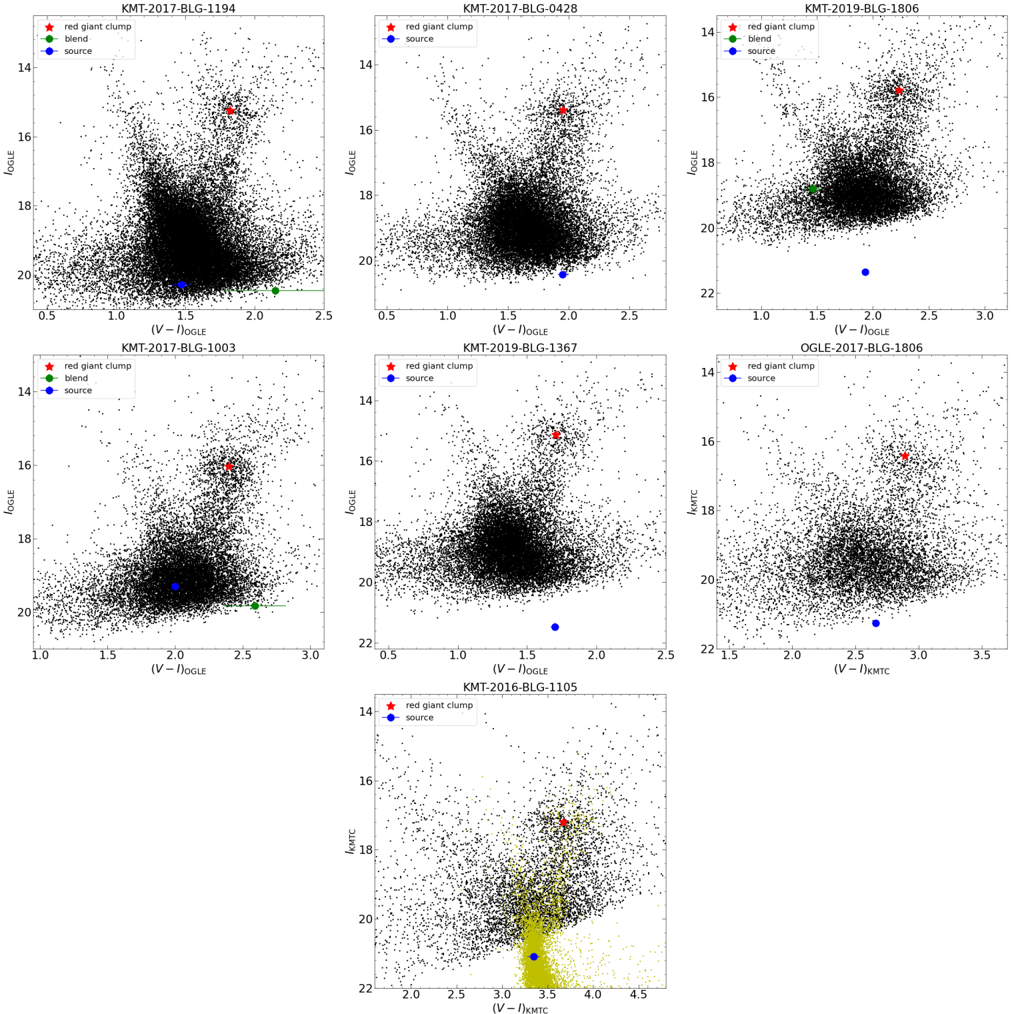
## Scatter Plots: Color-Magnitude Relationships for Astrophysical Objects
### Overview
The image contains seven scatter plots arranged in a 3x3 grid (with one plot centered below). Each plot visualizes the relationship between color index (V - I) and magnitude (I_OGLE or I_KMTC) for astrophysical objects, with distinct markers for three components: red giant clump (red star), blend (green circle), and source (blue circle). The plots vary in axis ranges and density distributions.
---
### Components/Axes
1. **Axes Labels**:
- **X-axis**: (V - I_OGLE) or (V - I_KMTC) color index (units: magnitude difference).
- **Y-axis**: I_OGLE or I_KMTC magnitude (units: apparent magnitude).
- Example: KMT-2017-BLG-1194 uses (V - I_OGLE) vs. I_OGLE; KMT-2016-BLG-1105 uses (V - I_KMTC) vs. I_KMTC.
2. **Legends**:
- Positioned in the **top-left corner** of each plot.
- **Red star**: Red giant clump.
- **Green circle**: Blend.
- **Blue circle**: Source.
3. **Data Points**:
- Black dots represent background objects.
- Colored markers (red, green, blue) highlight specific components.
---
### Detailed Analysis
#### KMT-2017-BLG-1194
- **Red giant clump**: (V - I_OGLE) ≈ 1.5, I_OGLE ≈ 16.5.
- **Blend**: (V - I_OGLE) ≈ 2.0, I_OGLE ≈ 18.0.
- **Source**: (V - I_OGLE) ≈ 1.0, I_OGLE ≈ 17.0.
- **Trend**: Red giant clump dominates the lower-left; blend and source are scattered.
#### KMT-2017-BLG-0428
- **Red giant clump**: (V - I_OGLE) ≈ 1.8, I_OGLE ≈ 16.0.
- **Blend**: (V - I_OGLE) ≈ 2.2, I_OGLE ≈ 18.5.
- **Source**: (V - I_OGLE) ≈ 1.2, I_OGLE ≈ 17.5.
- **Trend**: Similar distribution to KMT-2017-BLG-1194 but with tighter clustering.
#### KMT-2019-BLG-1806
- **Red giant clump**: (V - I_OGLE) ≈ 1.7, I_OGLE ≈ 16.2.
- **Blend**: (V - I_OGLE) ≈ 2.1, I_OGLE ≈ 18.8.
- **Source**: (V - I_OGLE) ≈ 1.3, I_OGLE ≈ 17.8.
- **Trend**: Source points are more dispersed compared to other plots.
#### KMT-2017-BLG-1003
- **Red giant clump**: (V - I_OGLE) ≈ 1.4, I_OGLE ≈ 16.3.
- **Blend**: (V - I_OGLE) ≈ 2.3, I_OGLE ≈ 19.0.
- **Source**: (V - I_OGLE) ≈ 1.1, I_OGLE ≈ 17.2.
- **Trend**: Blend points extend further right, suggesting higher (V - I) values.
#### KMT-2019-BLG-1367
- **Red giant clump**: (V - I_OGLE) ≈ 1.6, I_OGLE ≈ 16.1.
- **Blend**: (V - I_OGLE) ≈ 2.4, I_OGLE ≈ 19.5.
- **Source**: (V - I_OGLE) ≈ 1.0, I_OGLE ≈ 17.0.
- **Trend**: Blend points show a gradient (yellow shading) in lower-right, indicating density variation.
#### KMT-2016-BLG-1105
- **Red giant clump**: (V - I_KMTC) ≈ 1.5, I_KMTC ≈ 16.0.
- **Blend**: (V - I_KMTC) ≈ 2.5, I_KMTC ≈ 20.0.
- **Source**: (V - I_KMTC) ≈ 1.2, I_KMTC ≈ 17.5.
- **Trend**: Source points are more spread out, with a noticeable outlier at (V - I_KMTC) ≈ 3.0, I_KMTC ≈ 22.0.
#### KMT-2019-BLG-1806 (Repeated)
- **Red giant clump**: (V - I_OGLE) ≈ 1.7, I_OGLE ≈ 16.2.
- **Blend**: (V - I_OGLE) ≈ 2.1, I_OGLE ≈ 18.8.
- **Source**: (V - I_OGLE) ≈ 1.3, I_OGLE ≈ 17.8.
- **Trend**: Consistent with the earlier KMT-2019-BLG-1806 plot.
---
### Key Observations
1. **Red Giant Clump**: Consistently located in the lower-left quadrant across all plots, indicating a distinct population with low (V - I) and moderate I magnitudes.
2. **Blend**: Positioned in the upper-right quadrant, suggesting higher (V - I) values and fainter magnitudes. The yellow gradient in KMT-2016-BLG-1105 implies a density gradient or contamination.
3. **Source**: Varies in position but generally lies between the red giant clump and blend. Outliers in KMT-2016-BLG-1105 (e.g., (V - I_KMTC) ≈ 3.0, I_KMTC ≈ 22.0) may represent rare or anomalous objects.
4. **Axis Ranges**: Plots differ in axis limits, reflecting variations in observed object populations.
---
### Interpretation
- **Color-Magnitude Relationships**: The separation of red giant clump, blend, and source suggests distinct evolutionary stages or contamination sources. The red giant clump’s position aligns with known stellar populations, while blends may represent unresolved binaries or foreground objects.
- **Anomalies**: The outlier in KMT-2016-BLG-1105 (high (V - I_KMTC), high I_KMTC) could indicate a foreground star or instrumental artifact.
- **Gradient in KMT-2016-BLG-1105**: The yellow shading near the blend suggests a density gradient, possibly due to overlapping objects or systematic errors in data reduction.
These plots highlight the importance of component separation in microlensing surveys, where blends and foreground sources can mimic or obscure true microlensing events.