## Line Chart: Model Performance Scores (SimpleQA vs. BrowseComp)
### Overview
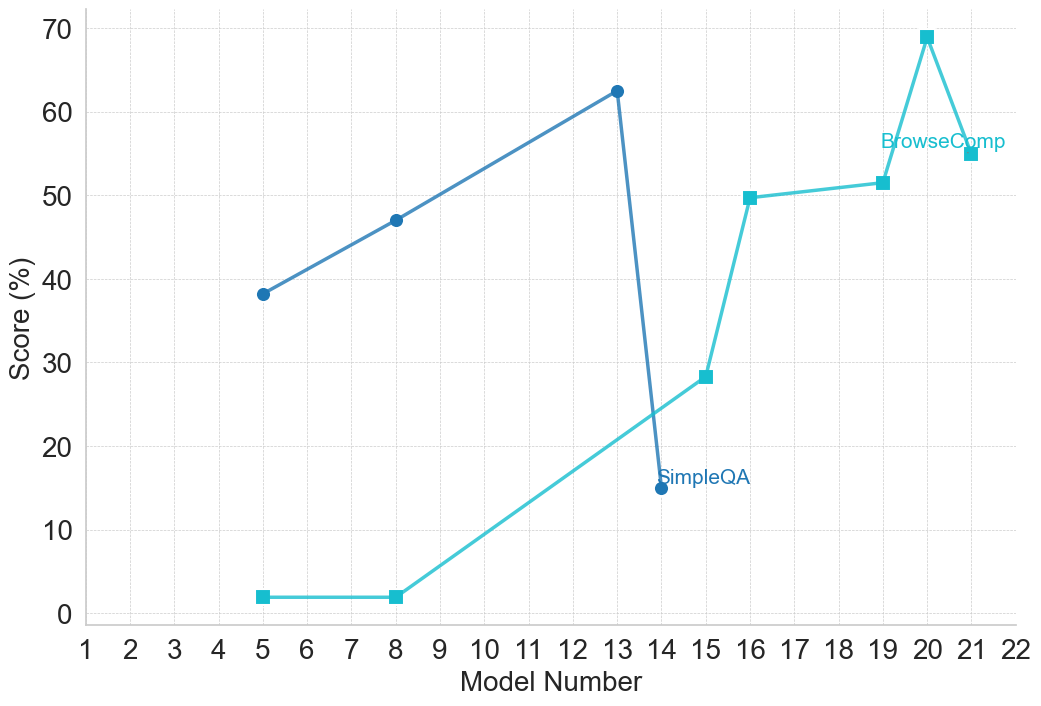
This image is a 2D line chart tracking the performance scores of two distinct evaluation metrics—"SimpleQA" and "BrowseComp"—across a sequential series of "Model Numbers." The chart uses two distinct lines with different colors and marker shapes to differentiate the data series. There is no traditional legend box; instead, the series labels are placed directly on the chart area adjacent to specific data points.
*Language Declaration:* All text in this image is in English.
### Components/Axes
**1. Y-Axis (Vertical, Left)**
* **Label:** "Score (%)" (Rotated 90 degrees counter-clockwise, positioned centrally along the axis).
* **Scale:** Ranges from 0 to 70.
* **Markers:** Major tick marks are placed at intervals of 10 (0, 10, 20, 30, 40, 50, 60, 70).
* **Grid:** Faint, light gray, dashed horizontal lines extend from each major tick mark across the chart area.
**2. X-Axis (Horizontal, Bottom)**
* **Label:** "Model Number" (Positioned centrally below the axis numbers).
* **Scale:** Ranges from 1 to 22.
* **Markers:** Major tick marks are placed at intervals of 1 (1, 2, 3, 4, 5, 6, 7, 8, 9, 10, 11, 12, 13, 14, 15, 16, 17, 18, 19, 20, 21, 22).
* **Grid:** Faint, light gray, dashed vertical lines extend upward from each major tick mark.
**3. Inline Legends (Spatial Grounding)**
* **SimpleQA:** The text "SimpleQA" is written in dark blue. It is positioned in the lower-middle-right section of the chart, immediately to the right of the dark blue data point at Model Number 14.
* **BrowseComp:** The text "BrowseComp" is written in light teal. It is positioned in the upper-right section of the chart, placed horizontally between Model Numbers 19 and 21, just below the peak data point at Model Number 20.
### Detailed Analysis
**Data Series 1: SimpleQA**
* **Visual Identification:** Dark blue line with solid circle markers.
* **Trend Verification:** The line begins at Model 5, slopes upward at a moderate, steady pace through Model 8 to reach its peak at Model 13. Immediately following this peak, the line drops precipitously to its lowest recorded point at Model 14, where the data series ends.
* **Data Points (Approximate values ±0.5%):**
* Model 5: ~38.0%
* Model 8: ~47.0%
* Model 13: ~62.5% (Peak)
* Model 14: ~15.0% (Lowest point; label "SimpleQA" is placed here)
**Data Series 2: BrowseComp**
* **Visual Identification:** Light teal line with solid square markers.
* **Trend Verification:** The line begins at Model 5 at a near-zero baseline and remains completely flat until Model 8. From Model 8, it slopes upward steadily to Model 15, then jumps sharply to Model 16. It plateaus slightly, rising only marginally to Model 19, before spiking sharply to its absolute peak at Model 20. Finally, it experiences a moderate decline at Model 21, where the data series ends.
* **Data Points (Approximate values ±0.5%):**
* Model 5: ~2.0%
* Model 8: ~2.0%
* Model 15: ~28.5%
* Model 16: ~49.5%
* Model 19: ~51.5%
* Model 20: ~69.0% (Peak; label "BrowseComp" is placed just below this)
* Model 21: ~55.0%
### Key Observations
* **Intersection:** The visual paths of the two lines cross between Model 13 and Model 15. During this window, SimpleQA experiences a catastrophic drop, while BrowseComp is in the middle of a steady climb.
* **Data Sparsity:** Neither series has data points for every model number on the x-axis. There are large gaps (e.g., between Model 8 and 13 for SimpleQA, and Model 8 and 15 for BrowseComp).
* **Asynchronous Lifespans:** The SimpleQA evaluation stops at Model 14, whereas the BrowseComp evaluation continues up to Model 21.
* **Post-Peak Drops:** Both metrics exhibit a significant drop in performance immediately after reaching their respective maximum scores (SimpleQA drops 47.5% after Model 13; BrowseComp drops 14% after Model 20).
### Interpretation
* **Model Evolution and Trade-offs:** The chart strongly suggests a sequential training or development process of a machine learning model (or family of models). The data illustrates a classic case of competing objectives or "catastrophic forgetting."
* **Phase 1 (Models 5-13):** Early in the development cycle, the model was optimized for "SimpleQA," achieving a respectable ~62.5% score. During this phase, it possessed virtually no capability for the "BrowseComp" task (~2%).
* **The Pivot (Models 13-15):** A major shift in training methodology, architecture, or dataset likely occurred here. As the developers pushed the model to learn "BrowseComp" (which begins to rise), the model completely lost its ability to perform "SimpleQA" (crashing to 15%). Because SimpleQA data is no longer plotted after Model 14, it is highly probable the developers abandoned that metric for this specific model branch, focusing entirely on the new capability.
* **Phase 2 (Models 15-21):** The later models show rapid, though somewhat unstable, improvement in "BrowseComp." The sharp spike at Model 20 followed by a drop at Model 21 indicates that while high performance is achievable, the training state at that peak might be brittle or overfitted, leading to a regression in the subsequent iteration.