## Line Chart: Model Performance Comparison
### Overview
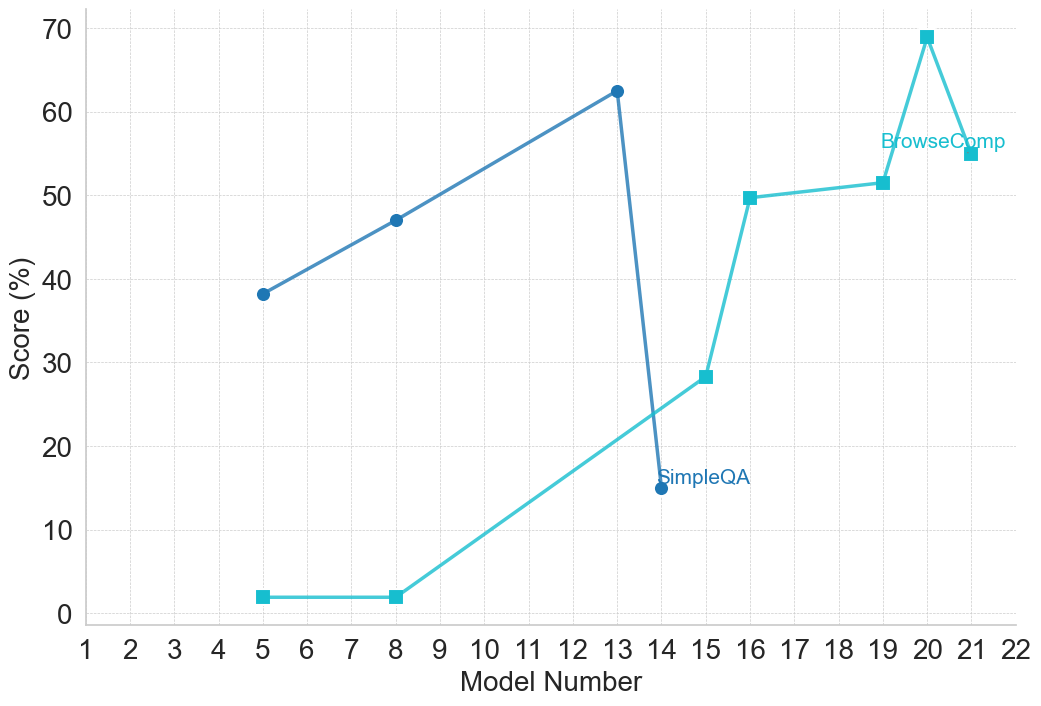
The image is a line chart comparing the performance of two models, "BrowseComp" and "SimpleQA," across different model numbers. The chart plots the score (in percentage) on the y-axis against the model number on the x-axis.
### Components/Axes
* **X-axis:** "Model Number" ranging from 1 to 22, with integer increments.
* **Y-axis:** "Score (%)" ranging from 0 to 70, with increments of 10.
* **Legend:**
* "BrowseComp" is represented by a light blue line with square markers.
* "SimpleQA" is represented by a dark blue line with circle markers.
### Detailed Analysis
* **BrowseComp (Light Blue, Square Markers):**
* The line starts at Model Number 5 with a score of approximately 2%.
* It remains relatively flat until Model Number 8, staying around 2%.
* The line then increases to approximately 28% at Model Number 15.
* The line increases to approximately 50% at Model Number 16.
* The line remains relatively flat until Model Number 19, staying around 51%.
* The line increases sharply to approximately 69% at Model Number 20.
* The line decreases to approximately 54% at Model Number 21.
* **SimpleQA (Dark Blue, Circle Markers):**
* The line starts at Model Number 5 with a score of approximately 38%.
* It increases to approximately 47% at Model Number 8.
* The line increases sharply to approximately 62% at Model Number 13.
* The line drops sharply to approximately 16% at Model Number 15.
### Key Observations
* SimpleQA initially outperforms BrowseComp.
* BrowseComp shows a significant performance increase in later model numbers.
* SimpleQA experiences a sharp performance drop after Model Number 13.
* BrowseComp has a peak at Model Number 20.
### Interpretation
The chart suggests that while SimpleQA starts with a higher score, its performance degrades significantly after a certain model number. BrowseComp, on the other hand, shows a steady improvement and eventually surpasses SimpleQA's performance. This could indicate that BrowseComp is better suited for later iterations or more complex models, while SimpleQA might be more effective for earlier, simpler models. The sharp drop in SimpleQA's performance warrants further investigation to understand the underlying cause. The peak of BrowseComp at Model 20, followed by a slight decrease, could indicate an optimal point in the model's development.