## Line Chart: Model Performance Comparison
### Overview
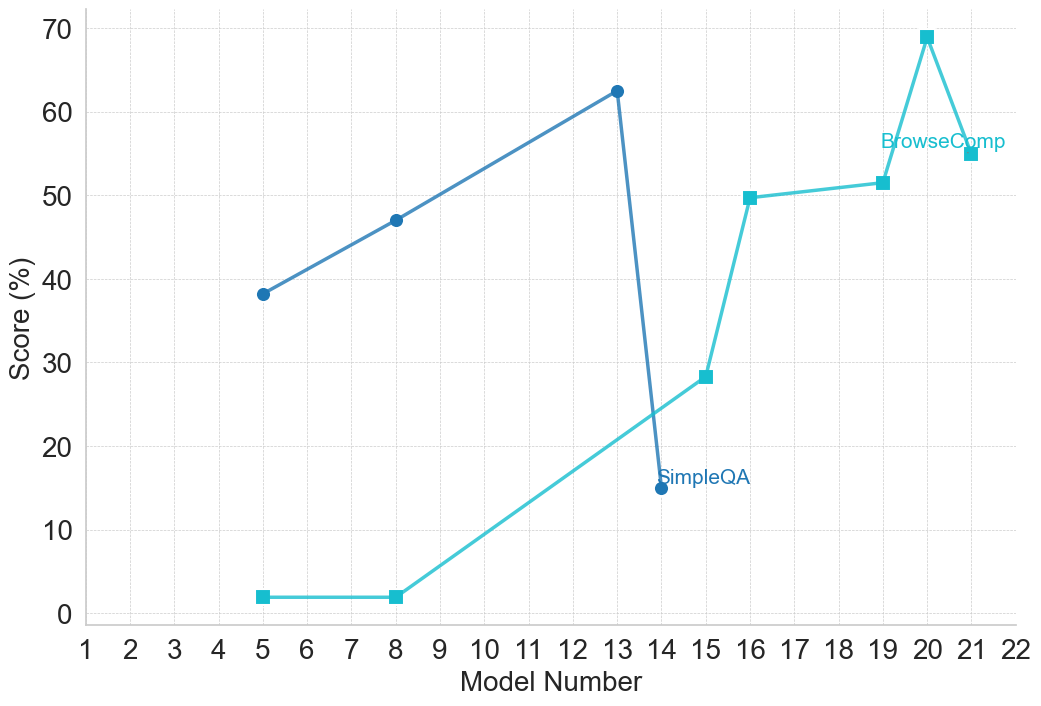
This line chart compares the performance scores of two models, "BrowseComp" and "SimpleQA", across a range of model numbers from 1 to 22. The y-axis represents the score in percentage, while the x-axis represents the model number.
### Components/Axes
* **X-axis:** "Model Number" ranging from 1 to 22.
* **Y-axis:** "Score (%)" ranging from 0 to 70.
* **Data Series 1:** "BrowseComp" - Represented by a cyan line.
* **Data Series 2:** "SimpleQA" - Represented by a blue line.
* **Legend:** Located in the top-right corner, labeling the two data series with their respective colors.
### Detailed Analysis
**BrowseComp (Cyan Line):**
The BrowseComp line starts at approximately 38% at Model Number 4. It exhibits an upward trend, reaching a peak of approximately 63% at Model Number 13. After Model Number 13, the line sharply declines to around 28% at Model Number 15, then plateaus around 50% from Model Number 16 to 19, and finally increases to approximately 68% at Model Number 21.
* Model 4: ~38%
* Model 5: ~40%
* Model 6: ~44%
* Model 7: ~47%
* Model 8: ~48%
* Model 9: ~48%
* Model 10: ~53%
* Model 11: ~58%
* Model 12: ~61%
* Model 13: ~63%
* Model 14: ~15%
* Model 15: ~28%
* Model 16: ~50%
* Model 17: ~50%
* Model 18: ~50%
* Model 19: ~50%
* Model 20: ~53%
* Model 21: ~68%
**SimpleQA (Blue Line):**
The SimpleQA line starts at approximately 2% at Model Number 5. It gradually increases, reaching around 14% at Model Number 13. It then rises sharply to approximately 50% at Model Number 16, and remains relatively stable around 50% until Model Number 21.
* Model 5: ~2%
* Model 6: ~2%
* Model 7: ~2%
* Model 8: ~2%
* Model 9: ~2%
* Model 10: ~8%
* Model 11: ~12%
* Model 12: ~14%
* Model 13: ~14%
* Model 14: ~15%
* Model 15: ~28%
* Model 16: ~50%
* Model 17: ~50%
* Model 18: ~50%
* Model 19: ~50%
* Model 20: ~50%
* Model 21: ~50%
### Key Observations
* BrowseComp generally outperforms SimpleQA across most model numbers, except for a period between Model Numbers 14 and 16 where SimpleQA shows a significant increase.
* Both models exhibit a sharp performance drop for BrowseComp at Model Number 14 and a significant increase for SimpleQA at Model Number 16. This suggests a potential change or event affecting the models around these points.
* BrowseComp shows a large performance swing, with a peak at Model 13 and a subsequent drop, followed by a recovery.
* SimpleQA demonstrates a more consistent upward trend after Model Number 10.
### Interpretation
The chart demonstrates the performance evolution of two models, BrowseComp and SimpleQA, as the model number increases. The data suggests that BrowseComp is generally more capable, but its performance is more volatile. The significant changes in performance around Model Numbers 14-16 for both models are particularly noteworthy. This could indicate a change in the training data, model architecture, or evaluation methodology. The plateauing of SimpleQA's performance after Model Number 16 suggests it may have reached a performance limit with the current approach. The large increase in BrowseComp at Model 21 suggests a significant improvement or optimization was implemented. Further investigation is needed to understand the reasons behind these fluctuations and to determine the optimal model number for each model. The chart provides valuable insights into the strengths and weaknesses of each model and can inform future development efforts.