\n
## Line Chart: Validation Perplexity vs. Step for Different Recurrence Values
### Overview
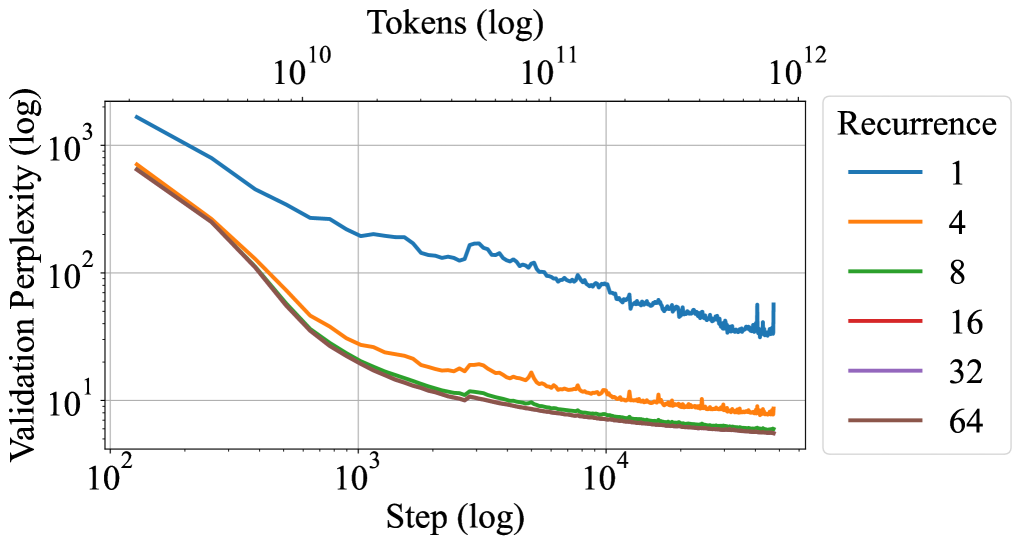
This chart displays the relationship between Validation Perplexity and Step (both on a logarithmic scale) for different Recurrence values. The chart aims to show how the model's perplexity decreases as the number of steps increases, and how this decrease varies with different recurrence settings.
### Components/Axes
* **X-axis:** Step (log scale), ranging from approximately 10<sup>2</sup> to 10<sup>4</sup>.
* **Y-axis:** Validation Perplexity (log scale), ranging from approximately 10<sup>2</sup> to 10<sup>3</sup>.
* **Legend:** Located in the top-right corner, indicating the Recurrence values for each line: 1, 4, 8, 16, 32, and 64.
* **Gridlines:** Present to aid in reading values.
* **Data Series:** Six lines, each representing a different Recurrence value.
### Detailed Analysis
The chart shows six lines, each representing a different recurrence value. The lines represent the validation perplexity as a function of the step.
* **Recurrence = 1 (Blue Line):** Starts at approximately 10<sup>3</sup> perplexity and initially decreases rapidly. Around a step of 10<sup>3</sup>, the decrease slows down, and the line exhibits significant oscillations, leveling off around a perplexity of approximately 80-120.
* **Recurrence = 4 (Orange Line):** Starts at approximately 10<sup>2</sup> perplexity and decreases more smoothly than the blue line. It reaches a perplexity of around 10-20 and remains relatively stable.
* **Recurrence = 8 (Green Line):** Starts at approximately 10<sup>2</sup> perplexity and decreases rapidly, similar to the orange line. It reaches a perplexity of around 5-10 and remains relatively stable.
* **Recurrence = 16 (Red Line):** Starts at approximately 10<sup>2</sup> perplexity and decreases rapidly, similar to the green line. It reaches a perplexity of around 2-5 and remains relatively stable.
* **Recurrence = 32 (Purple Line):** Starts at approximately 10<sup>2</sup> perplexity and decreases rapidly, similar to the red line. It reaches a perplexity of around 1-3 and remains relatively stable.
* **Recurrence = 64 (Brown Line):** Starts at approximately 10<sup>2</sup> perplexity and decreases rapidly, similar to the purple line. It reaches a perplexity of around 1-2 and remains relatively stable.
All lines, except for the blue line (Recurrence = 1), show a consistent downward trend and then plateau.
### Key Observations
* Higher recurrence values (32, 64) achieve lower perplexity values and stabilize faster than lower recurrence values.
* Recurrence = 1 exhibits significant oscillations and does not reach as low a perplexity as the other recurrence values.
* The perplexity decreases rapidly initially for all recurrence values, then the rate of decrease slows down.
* The chart demonstrates a clear trade-off between recurrence and validation perplexity.
### Interpretation
The data suggests that increasing the recurrence value generally leads to a lower validation perplexity, indicating a better model fit. However, the recurrence value of 1 is an outlier, exhibiting instability and a higher perplexity. This could indicate that a recurrence of 1 is insufficient for capturing the dependencies in the data. The plateauing of the lines suggests that there is a point of diminishing returns, where increasing the step further does not significantly improve the model's performance. The logarithmic scales on both axes highlight the initial rapid improvement followed by a slower convergence. The chart is likely demonstrating the effect of different memory lengths (recurrence) on the performance of a recurrent neural network or similar sequential model. The oscillations in the blue line could be due to the model struggling to learn long-range dependencies with a small recurrence value.