## Line Chart: Validation Perplexity vs. Steps (Log Scale)
### Overview
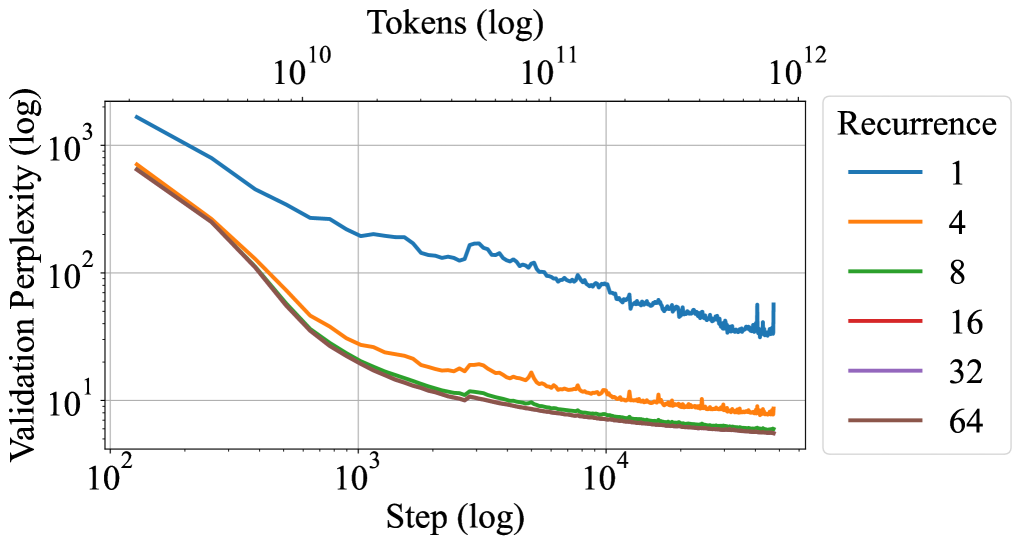
The chart illustrates the relationship between **validation perplexity** (log scale) and **training steps** (log scale) for different **recurrence values** (1, 4, 8, 16, 32, 64). Perplexity decreases as steps increase, with higher recurrence values achieving lower perplexity more rapidly.
---
### Components/Axes
- **X-axis (Step)**: Logarithmic scale from 10² to 10¹².
- **Y-axis (Validation Perplexity)**: Logarithmic scale from 10¹ to 10³.
- **Legend**: Right-aligned, mapping colors to recurrence values:
- Blue: 1
- Orange: 4
- Green: 8
- Red: 16
- Purple: 32
- Brown: 64
---
### Detailed Analysis
1. **Recurrence = 1 (Blue Line)**:
- Starts at ~10³ perplexity at 10² steps.
- Gradually declines to ~10² by 10⁴ steps.
- Slows near 10⁵ steps, stabilizing around 10².
2. **Recurrence = 4 (Orange Line)**:
- Begins at ~10².5 at 10² steps.
- Drops to ~10¹.5 by 10³ steps.
- Fluctuates slightly but trends downward to ~10¹ by 10⁴ steps.
3. **Recurrence = 8 (Green Line)**:
- Starts at ~10² at 10² steps.
- Declines to ~10¹ by 10³ steps.
- Stabilizes near 10¹ by 10⁴ steps.
4. **Recurrence = 16 (Red Line)**:
- Begins at ~10¹.5 at 10² steps.
- Drops to ~10¹ by 10³ steps.
- Remains flat near 10¹ by 10⁴ steps.
5. **Recurrence = 32 (Purple Line)**:
- Starts at ~10¹ at 10² steps.
- Declines to ~10⁰.8 by 10³ steps.
- Stabilizes near 10⁰.8 by 10⁴ steps.
6. **Recurrence = 64 (Brown Line)**:
- Begins at ~10¹ at 10² steps.
- Drops to ~10⁰.7 by 10³ steps.
- Remains near 10⁰.7 by 10⁴ steps.
---
### Key Observations
- **Inverse Relationship**: Higher recurrence values correlate with lower perplexity across all steps.
- **Convergence**: Lines for recurrence ≥16 converge near 10¹ perplexity by 10⁴ steps.
- **Diminishing Returns**: Beyond 10⁴ steps, perplexity plateaus for all recurrence values.
- **Anomalies**: The blue line (recurrence=1) shows minor fluctuations near 10⁵ steps, but no significant outliers.
---
### Interpretation
The data demonstrates that **increasing recurrence improves model performance** (lower perplexity) during training. Higher recurrence values achieve lower perplexity faster, but the benefit plateaus after ~10⁴ steps. The convergence of lines at higher recurrence values suggests **diminishing returns** for very large recurrence settings. The blue line (recurrence=1) highlights the trade-off: lower recurrence requires more steps to reach comparable perplexity. This aligns with expectations in sequence modeling, where recurrence depth often balances computational cost and performance.