## Line Chart: Accuracy vs. Thinking Compute for Different Reasoning Methods
### Overview
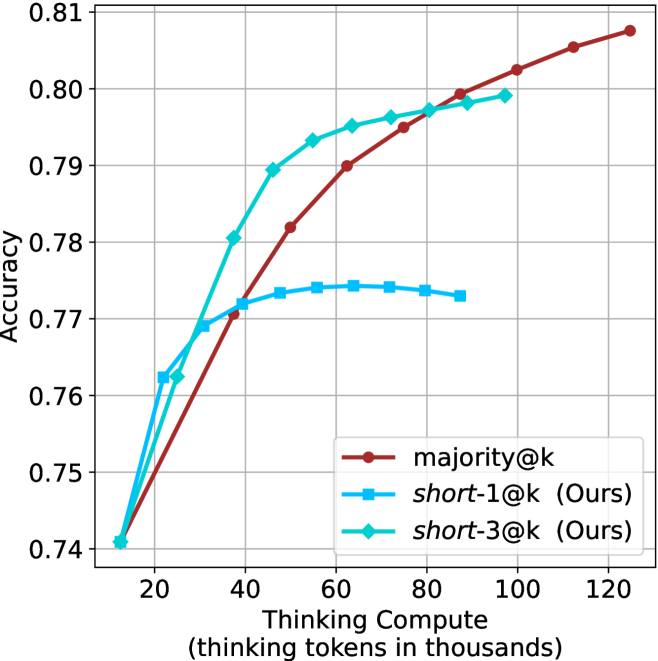
The image is a line chart comparing the performance of three different computational reasoning methods. It plots model accuracy against the amount of "Thinking Compute" allocated, measured in thousands of thinking tokens. The chart demonstrates how accuracy scales with increased computational resources for each method.
### Components/Axes
* **X-Axis (Horizontal):** Labeled "Thinking Compute (thinking tokens in thousands)". The scale runs from 0 to 120, with major tick marks at intervals of 20 (0, 20, 40, 60, 80, 100, 120).
* **Y-Axis (Vertical):** Labeled "Accuracy". The scale runs from 0.74 to 0.81, with major tick marks at intervals of 0.01 (0.74, 0.75, 0.76, 0.77, 0.78, 0.79, 0.80, 0.81).
* **Legend:** Located in the bottom-right quadrant of the chart area. It contains three entries:
1. `majority@k` - Represented by a solid red line with circular markers.
2. `short-1@k (Ours)` - Represented by a solid blue line with square markers.
3. `short-3@k (Ours)` - Represented by a solid cyan (light blue) line with diamond markers.
* **Grid:** A light gray grid is present, aligning with the major tick marks on both axes.
### Detailed Analysis
**1. `majority@k` (Red Line, Circle Markers):**
* **Trend:** Shows a steady, near-linear upward trend across the entire range of compute. It has the steepest sustained slope.
* **Data Points (Approximate):**
* Starts at ~0.74 accuracy at 10k tokens.
* Crosses 0.77 accuracy at ~40k tokens.
* Crosses 0.79 accuracy at ~65k tokens.
* Crosses 0.80 accuracy at ~95k tokens.
* Ends at the highest point on the chart, ~0.808 accuracy at 120k tokens.
**2. `short-1@k (Ours)` (Blue Line, Square Markers):**
* **Trend:** Increases rapidly at low compute, then plateaus. The curve flattens significantly after ~50k tokens, showing diminishing returns.
* **Data Points (Approximate):**
* Starts at ~0.74 accuracy at 10k tokens.
* Rises sharply to ~0.762 at 20k tokens.
* Reaches ~0.771 at 40k tokens.
* Peaks and plateaus around 0.774 between 50k and 80k tokens.
* Shows a slight decline to ~0.773 at 90k tokens (the last data point for this series).
**3. `short-3@k (Ours)` (Cyan Line, Diamond Markers):**
* **Trend:** Exhibits the most rapid initial gain in accuracy, then also plateaus, but at a higher level than `short-1@k`. Its growth rate slows considerably after ~50k tokens.
* **Data Points (Approximate):**
* Starts at ~0.74 accuracy at 10k tokens.
* Rises very steeply to ~0.763 at 20k tokens.
* Reaches ~0.78 at 35k tokens.
* Crosses 0.79 accuracy at ~45k tokens.
* Plateaus near 0.799-0.80 between 80k and 100k tokens (the last data point for this series).
### Key Observations
1. **Initial Efficiency:** Both "Ours" methods (`short-1@k` and `short-3@k`) show a steeper initial slope than `majority@k`, indicating they achieve higher accuracy with very low compute budgets (below ~30k tokens).
2. **Crossover Point:** The `majority@k` line intersects and surpasses the `short-1@k` line at approximately 40k tokens. It intersects the `short-3@k` line at approximately 80k tokens.
3. **Plateau vs. Continuous Growth:** The two "Ours" methods plateau, suggesting a limit to the accuracy gains achievable by their specific approach with more compute. In contrast, `majority@k` continues to improve steadily, indicating its scaling behavior is different and potentially more robust at high compute levels.
4. **Performance Hierarchy:** At low compute (<40k tokens), the order is `short-3@k` > `short-1@k` ≈ `majority@k`. At high compute (>80k tokens), the order becomes `majority@k` > `short-3@k` > `short-1@k`.
### Interpretation
This chart illustrates a classic trade-off in machine learning between **sample efficiency** and **scalability**.
* The methods labeled "(Ours)" (`short-1@k` and `short-3@k`) are highly **sample/compute-efficient**. They extract maximum accuracy from a limited thinking budget, making them ideal for applications where computational cost or latency is a primary constraint. `short-3@k` is clearly the more effective of the two efficient methods.
* The `majority@k` method represents a **scalable** approach. While less efficient initially, its performance continues to improve predictably with more resources. This suggests it may be a more reliable or powerful technique when computational constraints are relaxed, and maximum accuracy is the goal, regardless of cost.
* The plateauing of the "Ours" methods could indicate a fundamental limitation in their architecture or strategy—they may be "thinking" in a way that quickly hits a ceiling of effectiveness. The continuous rise of `majority@k` suggests its "thinking" process (likely involving majority voting over multiple reasoning paths) benefits more consistently from additional computation.
* **Practical Implication:** The choice between these methods depends on the deployment context. For a real-time chatbot, an efficient method like `short-3@k` is preferable. For a offline, high-stakes analysis where accuracy is paramount, `majority@k` would be the better choice given sufficient compute resources.