## Line Graph: Accuracy vs. Thinking Tokens (in Thousands)
### Overview
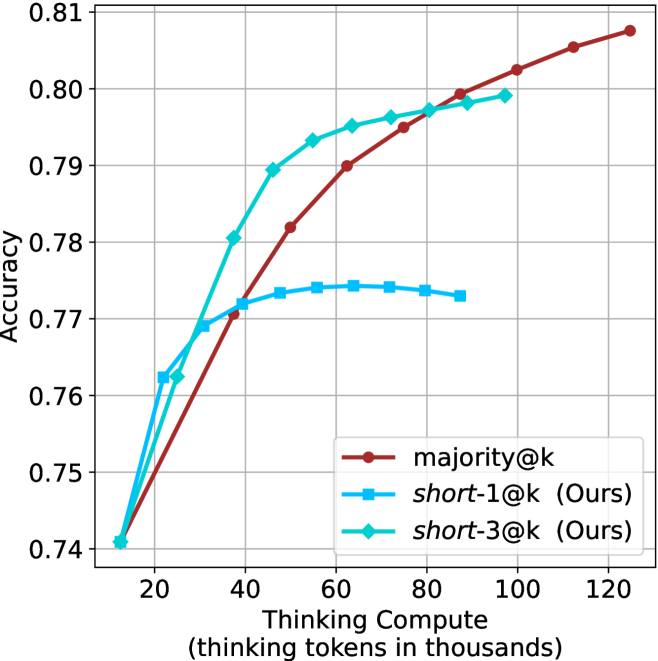
The image is a line graph comparing the accuracy of three methods—**majority@k**, **short-1@k (Ours)**, and **short-3@k (Ours)**—as a function of the number of thinking tokens (in thousands). The x-axis represents the number of thinking tokens, and the y-axis represents accuracy (ranging from 0.74 to 0.81). Three distinct lines are plotted, each corresponding to a method, with the legend positioned in the bottom-right corner.
---
### Components/Axes
- **X-axis**: "Thinking tokens in thousands" (range: 20 to 120, increments of 20).
- **Y-axis**: "Accuracy" (range: 0.74 to 0.81, increments of 0.01).
- **Legend**: Located in the bottom-right corner, with three entries:
- **Red**: majority@k
- **Blue**: short-1@k (Ours)
- **Green**: short-3@k (Ours)
---
### Detailed Analysis
#### 1. **majority@k (Red Line)**
- **Trend**: Starts at the lowest point (0.74 at 20k tokens) and increases steadily.
- **Key Data Points**:
- 20k tokens: ~0.74
- 40k tokens: ~0.76
- 60k tokens: ~0.77
- 80k tokens: ~0.78
- 100k tokens: ~0.79
- 120k tokens: ~0.81
#### 2. **short-1@k (Ours) (Blue Line)**
- **Trend**: Starts higher than majority@k but plateaus after 60k tokens.
- **Key Data Points**:
- 20k tokens: ~0.76
- 40k tokens: ~0.77
- 60k tokens: ~0.77
- 80k tokens: ~0.77
- 100k tokens: ~0.77
- 120k tokens: ~0.765
#### 3. **short-3@k (Ours) (Green Line)**
- **Trend**: Starts at the lowest point (0.74 at 20k tokens), rises sharply, dips slightly, then surpasses majority@k after 100k tokens.
- **Key Data Points**:
- 20k tokens: ~0.74
- 40k tokens: ~0.78
- 60k tokens: ~0.79
- 80k tokens: ~0.785
- 100k tokens: ~0.795
- 120k tokens: ~0.81
---
### Key Observations
1. **majority@k** shows a consistent upward trend, achieving the highest accuracy (0.81) at 120k tokens.
2. **short-1@k** plateaus at ~0.77 after 60k tokens, indicating diminishing returns.
3. **short-3@k** initially underperforms but surpasses majority@k after 100k tokens, suggesting potential for optimization.
4. The green line (short-3@k) dips slightly at 80k tokens but recovers by 100k tokens.
---
### Interpretation
The data suggests that **majority@k** is the most reliable method for accuracy across all token ranges, while **short-3@k** demonstrates a non-linear improvement, possibly due to adaptive scaling or optimization. The **short-1@k** method’s plateau implies it may not benefit from additional tokens beyond 60k. The dip in short-3@k at 80k tokens could indicate a temporary inefficiency, but its recovery suggests robustness in larger-scale applications. This highlights the importance of method selection based on token availability and performance goals.