# Technical Document Extraction: Density Plots of Actions across Turns
## 1. Document Metadata
* **Title:** Density Plots of Actions across Turns
* **Chart Type:** Kernel Density Estimation (KDE) Plot / Multi-series Density Plot
* **Primary Language:** English
## 2. Component Isolation
### A. Header
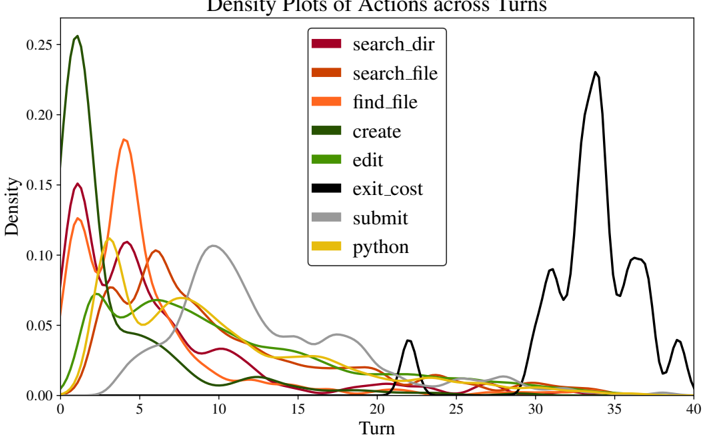
* **Text:** "Density Plots of Actions across Turns" (Centered at the top).
### B. Main Chart Area
* **Y-Axis Label:** "Density"
* **Y-Axis Scale:** Linear, ranging from 0.00 to 0.25 with markers at [0.00, 0.05, 0.10, 0.15, 0.20, 0.25].
* **X-Axis Label:** "Turn"
* **X-Axis Scale:** Linear, ranging from 0 to 40 with markers every 5 units [0, 5, 10, 15, 20, 25, 30, 35, 40].
### C. Legend (Spatial Grounding: Top-Center/Right)
The legend is located in the upper-middle portion of the plot area, containing eight categories with corresponding color swatches:
1. **search_dir:** Dark Red / Maroon
2. **search_file:** Burnt Orange / Rust
3. **find_file:** Bright Orange
4. **create:** Dark Green
5. **edit:** Medium Green
6. **exit_cost:** Black
7. **submit:** Grey
8. **python:** Gold / Yellow
---
## 3. Data Series Analysis and Trends
### Early-Phase Actions (Turns 0–10)
These actions show high density at the beginning of the process, indicating they are primarily initialization or discovery steps.
* **create (Dark Green):**
* *Trend:* Sharp, immediate spike.
* *Peak:* Reaches the highest density of all series (~0.26) at approximately Turn 1. It drops off rapidly, becoming negligible after Turn 5.
* **search_dir (Dark Red):**
* *Trend:* Rapid rise and fall with a secondary smaller hump.
* *Peak:* Primary peak at Turn 1 (~0.15 density); secondary peak at Turn 4 (~0.11 density).
* **find_file (Bright Orange):**
* *Trend:* Bimodal distribution.
* *Peak:* First peak at Turn 1 (~0.13); second, higher peak at Turn 4 (~0.18).
* **search_file (Burnt Orange):**
* *Trend:* Broad distribution in the early phase.
* *Peak:* Peaks around Turn 6 (~0.10 density).
* **python (Gold):**
* *Trend:* Gradual rise in the early phase.
* *Peak:* Peaks around Turn 3 (~0.11 density) and maintains a low-level "tail" across the mid-turns.
### Mid-Phase Actions (Turns 5–25)
* **edit (Medium Green):**
* *Trend:* Broad, low-amplitude distribution.
* *Peak:* Peaks around Turn 7 (~0.07 density) and slowly tapers off toward Turn 30.
* **submit (Grey):**
* *Trend:* Shifted further right than discovery actions; multi-modal.
* *Peak:* Primary peak at Turn 10 (~0.11 density). It shows smaller fluctuations (local maxima) around Turn 18 and Turn 28.
### Late-Phase Actions (Turns 20–40)
* **exit_cost (Black):**
* *Trend:* Distinctly separated from all other actions. It is nearly zero for the first 20 turns, followed by a small spike and then a massive surge at the end.
* *Peak:* Small local peak at Turn 22 (~0.04). The dominant peak occurs at Turn 34 (~0.23 density), with a secondary late peak at Turn 37 (~0.10).
---
## 4. Summary of Key Findings
* **Initialization:** The "create" and "search_dir" actions are the most immediate, occurring almost exclusively in the first 1-3 turns.
* **Exploration/Execution:** "find_file" and "python" actions bridge the gap between initialization and the middle phase.
* **Processing:** "edit" and "submit" represent the middle of the workflow, with "submit" peaking significantly later (Turn 10) than the initial search actions.
* **Termination:** The "exit_cost" action is a clear outlier in time, representing the finality of the process, occurring almost entirely after Turn 30.