## Line Chart: Density Plots of Actions across Turns
### Overview
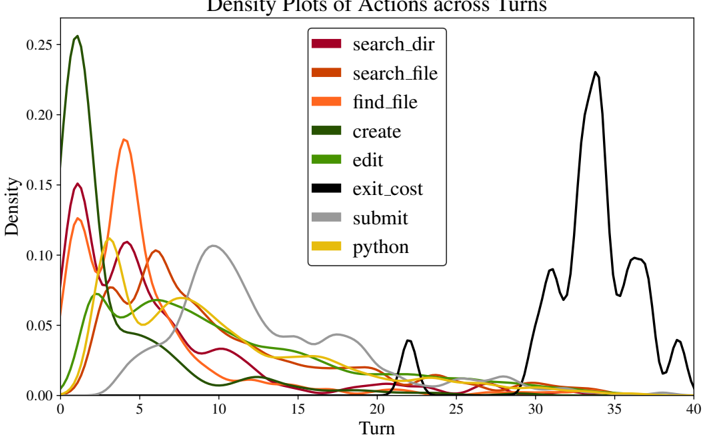
The chart displays density plots of eight distinct actions across 40 turns, with density values ranging from 0.00 to 0.25. Each action is represented by a colored line, showing peaks at specific turns where the action is most frequent. The legend identifies actions with unique colors, though two actions share the same color (yellow), creating ambiguity.
### Components/Axes
- **X-axis (Turn)**: Ranges from 0 to 40, labeled "Turn."
- **Y-axis (Density)**: Ranges from 0.00 to 0.25, labeled "Density."
- **Legend**:
- `search_dir` (red)
- `search_file` (orange)
- `find_file` (yellow)
- `create` (green)
- `edit` (lime)
- `exit_cost` (black)
- `submit` (gray)
- `python` (yellow)
*Note: Both `find_file` and `python` are assigned yellow, which may indicate a legend error.*
### Detailed Analysis
1. **`search_dir` (red)**: Peaks sharply at turn 2 (density ~0.25), then declines rapidly.
2. **`search_file` (orange)**: Peaks at turn 4 (density ~0.18), with a secondary smaller peak near turn 10.
3. **`find_file` (yellow)**: Peaks at turn 5 (density ~0.15), overlapping with `search_file` and `create`.
4. **`create` (green)**: Peaks at turn 3 (density ~0.12), with a secondary peak near turn 8.
5. **`edit` (lime)**: Peaks at turn 6 (density ~0.10), with a gradual decline.
6. **`exit_cost` (black)**: Dominates late turns, peaking at turn 34 (density ~0.22) with a secondary peak at turn 37.
7. **`submit` (gray)**: Peaks at turn 10 (density ~0.10), with a broad, shallow curve.
8. **`python` (yellow)**: Peaks at turn 35 (density ~0.18), overlapping with `exit_cost` in color.
### Key Observations
- **Color Ambiguity**: `find_file` and `python` share the same yellow color, making it impossible to distinguish their lines visually. This likely reflects a legend error.
- **Early vs. Late Actions**:
- Early turns (0–10) are dominated by exploratory actions (`search_dir`, `search_file`, `create`, `edit`, `submit`).
- Late turns (25–40) show spikes in `exit_cost` and `python`, suggesting finalization or specialized tasks.
- **Density Extremes**:
- `search_dir` has the highest peak (0.25), indicating it is the most frequent action early on.
- `exit_cost` has the second-highest peak (0.22) at turn 34, suggesting a critical cost calculation event.
- **Overlap**: `python` and `exit_cost` overlap in color and timing, complicating interpretation.
### Interpretation
The data suggests a workflow where initial actions focus on exploration (`search`, `create`, `edit`) and early submission, while later turns involve cost analysis (`exit_cost`) and specialized tasks (`python`). The shared yellow color for `find_file` and `python` introduces uncertainty, potentially conflating two distinct actions. The sharp peak of `exit_cost` at turn 34 may indicate a pivotal moment in the process, such as resource allocation or termination costs. The gradual decline of early actions implies a shift in focus toward finalization or optimization in later stages.