## Bar Chart: Pass@1 Accuracy Comparison Across Math Benchmarks
### Overview
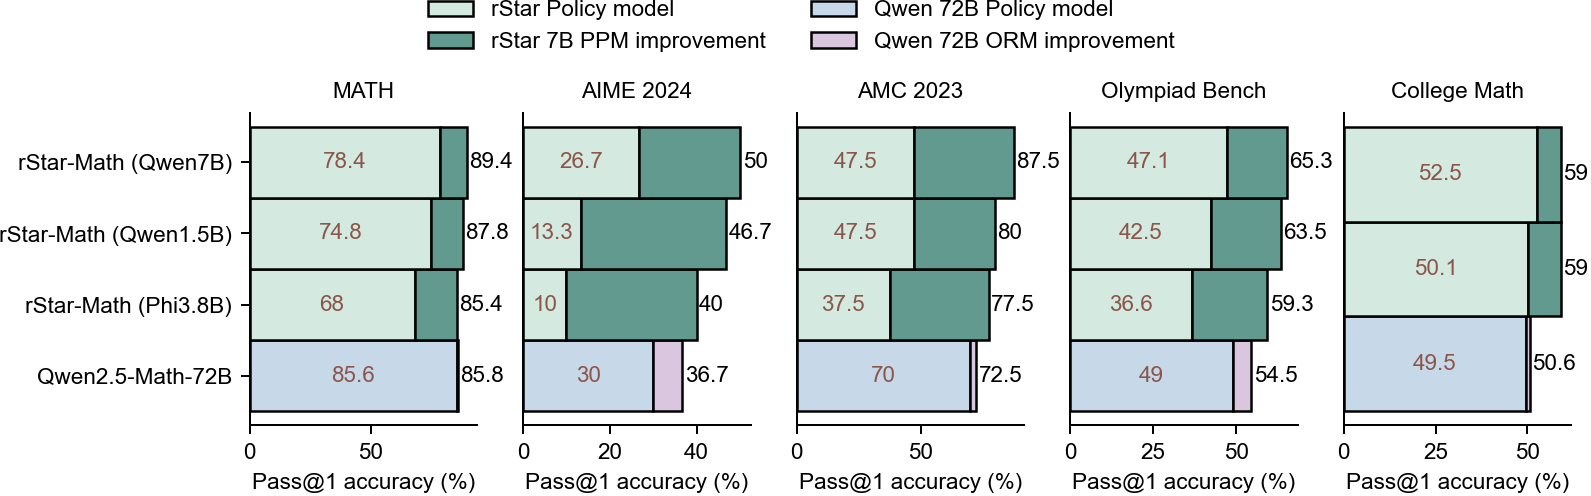
The chart compares the Pass@1 accuracy (%) of four math-focused models across five benchmarks: MATH, AIME 2024, AMC 2023, Olympiad Bench, and College Math. Each model is represented by two bars: one for the base policy model and one for the improvement (PPM or ORM). The legend distinguishes these using color coding.
### Components/Axes
- **X-axis**: Benchmarks (MATH, AIME 2024, AMC 2023, Olympiad Bench, College Math).
- **Y-axis**: Pass@1 accuracy (%) ranging from 0 to 100.
- **Legend**:
- Light green: rStar Policy model
- Dark green: rStar 7B PPM improvement
- Light blue: Qwen 72B Policy model
- Pink: Qwen 72B ORM improvement
### Detailed Analysis
#### MATH
- **rStar-Math (Qwen7B)**: 78.4% (light green) → 89.4% (dark green)
- **rStar-Math (Qwen1.5B)**: 74.8% → 87.8%
- **rStar-Math (Phi3.8B)**: 68% → 85.4%
- **Qwen2.5-Math-72B**: 85.6% → 85.8%
#### AIME 2024
- **rStar-Math (Qwen7B)**: 26.7% → 50%
- **rStar-Math (Qwen1.5B)**: 13.3% → 46.7%
- **rStar-Math (Phi3.8B)**: 10% → 40%
- **Qwen2.5-Math-72B**: 30% → 36.7%
#### AMC 2023
- **rStar-Math (Qwen7B)**: 47.5% → 87.5%
- **rStar-Math (Qwen1.5B)**: 47.5% → 80%
- **rStar-Math (Phi3.8B)**: 37.5% → 77.5%
- **Qwen2.5-Math-72B**: 70% → 72.5%
#### Olympiad Bench
- **rStar-Math (Qwen7B)**: 47.1% → 65.3%
- **rStar-Math (Qwen1.5B)**: 42.5% → 63.5%
- **rStar-Math (Phi3.8B)**: 36.6% → 59.3%
- **Qwen2.5-Math-72B**: 49% → 54.5%
#### College Math
- **rStar-Math (Qwen7B)**: 52.5% → 59%
- **rStar-Math (Qwen1.5B)**: 50.1% → 59%
- **rStar-Math (Phi3.8B)**: 49.5% → 50.6%
- **Qwen2.5-Math-72B**: 49.5% → 50.6%
### Key Observations
1. **rStar Models Show Significant Gains**: Across most benchmarks, rStar models (especially with PPM improvements) demonstrate substantial accuracy improvements. For example:
- In **AMC 2023**, rStar-Math (Qwen7B) jumps from 47.5% to 87.5%.
- In **AIME 2024**, rStar-Math (Qwen7B) increases from 26.7% to 50%.
2. **Qwen2.5-Math-72B Has High Baseline Performance**: This model consistently achieves the highest base accuracy (e.g., 85.6% in MATH, 70% in AMC 2023) but shows minimal improvement (e.g., +0.2% in MATH, +2.5% in AMC 2023).
3. **ORM Improvements Are Modest**: The Qwen 72B ORM improvement (pink) generally adds smaller gains compared to PPM improvements (dark green), suggesting policy models may be more impactful than ORM adjustments.
4. **Performance Variability**: rStar-Math (Phi3.8B) underperforms other rStar variants in most benchmarks but still shows notable improvement (e.g., +17.4% in MATH).
### Interpretation
The data highlights that **rStar models with PPM improvements** outperform other variants in most benchmarks, particularly in high-difficulty tasks like AIME 2024 and AMC 2023. The Qwen2.5-Math-72B model excels in baseline accuracy but offers limited room for improvement, indicating it may already be near optimal for these tasks. The smaller gains from ORM improvements suggest that policy model enhancements (PPM) are more critical for performance boosts than ORM adjustments. This could inform resource allocation for model development, prioritizing PPM over ORM for maximum impact.