## [Bar Chart]: Performance Comparison of Math Problem-Solving Models
### Overview
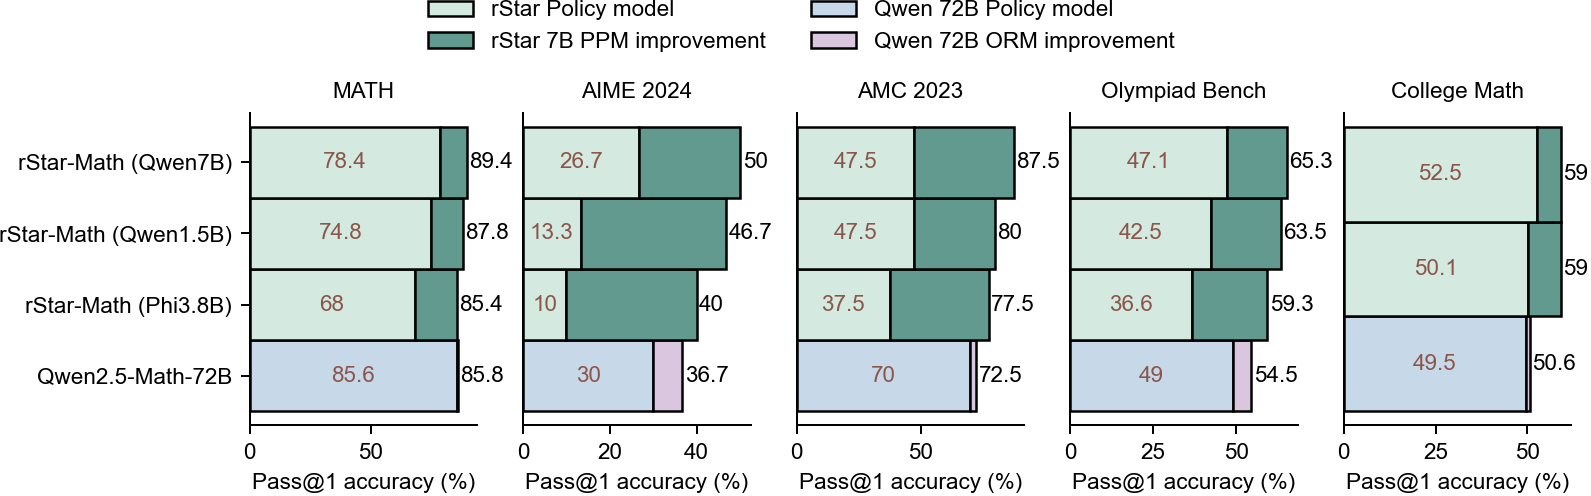
This image is a horizontal bar chart comparing the Pass@1 accuracy (%) of four different AI models across five mathematical benchmarks. The chart evaluates both a base "Policy model" and the improvement achieved through additional methods (PPM for rStar models, ORM for the Qwen model). The benchmarks are MATH, AIME 2024, AMC 2023, Olympiad Bench, and College Math.
### Components/Axes
* **Legend (Top Center):**
* `rStar Policy model` (Light Green)
* `rStar 7B PPM improvement` (Dark Green)
* `Qwen 72B Policy model` (Light Blue)
* `Qwen 72B ORM improvement` (Light Purple)
* **Vertical Axis (Left):** Lists the four models being compared:
1. `rStar-Math (Qwen7B)`
2. `rStar-Math (Qwen1.5B)`
3. `rStar-Math (Phi3.8B)`
4. `Qwen2.5-Math-72B`
* **Horizontal Axes (Bottom of each column):** Each benchmark has its own x-axis labeled `Pass@1 accuracy (%)` with varying scales (0-100 for MATH, 0-40 for AIME, 0-100 for AMC, 0-50 for Olympiad, 0-50 for College Math).
* **Column Headers (Top of each data column):** The five benchmarks: `MATH`, `AIME 2024`, `AMC 2023`, `Olympiad Bench`, `College Math`.
### Detailed Analysis
The chart is segmented into five vertical columns, one per benchmark. Each column contains four horizontal bars, one for each model. Each bar is split into two segments: the left segment (light color) represents the base policy model's accuracy, and the right segment (darker color) represents the improvement from the additional method (PPM or ORM). The total accuracy is the sum of both segments, indicated by a number at the end of the bar.
**1. MATH Benchmark:**
* **rStar-Math (Qwen7B):** Policy: 78.4%, Total: 89.4% (Improvement: +11.0%)
* **rStar-Math (Qwen1.5B):** Policy: 74.8%, Total: 87.8% (Improvement: +13.0%)
* **rStar-Math (Phi3.8B):** Policy: 68.0%, Total: 85.4% (Improvement: +17.4%)
* **Qwen2.5-Math-72B:** Policy: 85.6%, Total: 85.8% (Improvement: +0.2%)
**2. AIME 2024 Benchmark:**
* **rStar-Math (Qwen7B):** Policy: 26.7%, Total: 50.0% (Improvement: +23.3%)
* **rStar-Math (Qwen1.5B):** Policy: 13.3%, Total: 46.7% (Improvement: +33.4%)
* **rStar-Math (Phi3.8B):** Policy: 10.0%, Total: 40.0% (Improvement: +30.0%)
* **Qwen2.5-Math-72B:** Policy: 30.0%, Total: 36.7% (Improvement: +6.7%)
**3. AMC 2023 Benchmark:**
* **rStar-Math (Qwen7B):** Policy: 47.5%, Total: 87.5% (Improvement: +40.0%)
* **rStar-Math (Qwen1.5B):** Policy: 47.5%, Total: 80.0% (Improvement: +32.5%)
* **rStar-Math (Phi3.8B):** Policy: 37.5%, Total: 77.5% (Improvement: +40.0%)
* **Qwen2.5-Math-72B:** Policy: 70.0%, Total: 72.5% (Improvement: +2.5%)
**4. Olympiad Bench Benchmark:**
* **rStar-Math (Qwen7B):** Policy: 47.1%, Total: 65.3% (Improvement: +18.2%)
* **rStar-Math (Qwen1.5B):** Policy: 42.5%, Total: 63.5% (Improvement: +21.0%)
* **rStar-Math (Phi3.8B):** Policy: 36.6%, Total: 59.3% (Improvement: +22.7%)
* **Qwen2.5-Math-72B:** Policy: 49.0%, Total: 54.5% (Improvement: +5.5%)
**5. College Math Benchmark:**
* **rStar-Math (Qwen7B):** Policy: 52.5%, Total: 59.0% (Improvement: +6.5%)
* **rStar-Math (Qwen1.5B):** Policy: 50.1%, Total: 59.0% (Improvement: +8.9%)
* **rStar-Math (Phi3.8B):** Policy: 49.5%, Total: 50.6% (Improvement: +1.1%)
* **Qwen2.5-Math-72B:** Policy: 49.5%, Total: 50.6% (Improvement: +1.1%)
### Key Observations
1. **Consistent Improvement:** All three `rStar-Math` models show substantial accuracy gains from the PPM method across all benchmarks, with the improvement segments (dark green) being visually prominent.
2. **Diminishing Returns for Large Model:** The `Qwen2.5-Math-72B` model shows very small improvements from the ORM method (light purple slivers), especially on MATH (+0.2%) and College Math (+1.1%).
3. **Benchmark Difficulty:** Performance varies greatly by benchmark. AIME 2024 yields the lowest scores (max 50%), while MATH and AMC 2023 allow for higher total accuracies (up to 89.4% and 87.5%, respectively).
4. **Model Scaling Trend:** Within the rStar models, the one based on the largest policy model (Qwen7B) generally achieves the highest total accuracy, but the smaller models (Qwen1.5B, Phi3.8B) often show larger *relative* improvements from PPM.
### Interpretation
This chart demonstrates the effectiveness of the "PPM" (likely a planning or process-based method) in boosting the mathematical reasoning performance of medium-sized language models (7B, 1.5B, 3.8B parameters). The gains are most dramatic on challenging competition-style benchmarks like AIME and AMC, where the base policy model's performance is low, suggesting PPM is particularly valuable for complex, multi-step problem-solving.
In contrast, the "ORM" (likely an outcome-based reward model) applied to the very large `Qwen2.5-Math-72B` provides minimal additional benefit. This implies that for state-of-the-art large models already fine-tuned for math, outcome-based verification may have reached a performance ceiling, or that the specific ORM method used here is less effective than PPM for these tasks. The data argues that architectural or methodological innovations (like PPM) can be more impactful than simply scaling up model size for achieving high performance on difficult mathematical reasoning tasks.