## Scatter Plot: Energy vs. Number of Satisfied Clauses
### Overview
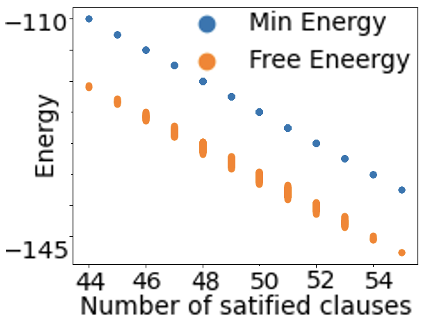
The image is a scatter plot comparing two energy metrics—Min Energy and Free Energy—across varying numbers of satisfied clauses. The plot uses distinct markers (blue circles for Min Energy, orange ovals for Free Energy) to differentiate the datasets. Both metrics decline as the number of satisfied clauses increases, with notable convergence at higher clause counts.
### Components/Axes
- **X-axis**: "Number of satisfied clauses" (integer values from 44 to 54, in increments of 2).
- **Y-axis**: "Energy" (continuous scale from -145 to -110, with negative values).
- **Legend**:
- Blue circles: Min Energy
- Orange ovals: Free Energy
- **Data Points**:
- Blue circles are consistently positioned above orange ovals across all x-axis values.
- Orange ovals exhibit vertical error bars (approximate uncertainty: ±2–3 units on the y-axis).
### Detailed Analysis
- **Min Energy (Blue Circles)**:
- Starts at approximately **-110** when clauses = 44.
- Declines linearly to **-145** at clauses = 54.
- Slope: ~-2.5 units per clause (calculated from total drop of 35 over 10 clauses).
- **Free Energy (Orange Ovals)**:
- Starts at **-145** when clauses = 44.
- Remains relatively flat until clauses = 52, then drops sharply to **-145** at clauses = 54.
- Slope: ~-0.5 units per clause (minimal change until final clause increment).
### Key Observations
1. **Convergence at High Clause Counts**: Both metrics reach **-145** at clauses = 54, suggesting a critical threshold where Min Energy and Free Energy align.
2. **Divergence at Low Clause Counts**: Min Energy is significantly higher (less negative) than Free Energy for clauses ≤ 48.
3. **Error in Free Energy**: Orange ovals show vertical uncertainty, implying variability in Free Energy measurements at lower clause counts.
### Interpretation
The plot reveals a phase-like relationship between energy metrics and clause satisfaction. Min Energy decreases predictably with increasing clauses, while Free Energy remains stable until a critical point (clauses ≥ 52), after which it drops sharply. This convergence at clauses = 54 may indicate a phase transition or criticality in the system, where Min Energy and Free Energy equilibrate. The stability of Free Energy at lower clause counts suggests robustness to minor clause satisfaction changes, whereas Min Energy’s steep decline highlights sensitivity to clause fulfillment. The error bars on Free Energy imply measurement uncertainty, particularly at lower clause counts, which could affect interpretations of its stability.