# Technical Document Extraction: Bar Chart Analysis
## 1. Chart Identification
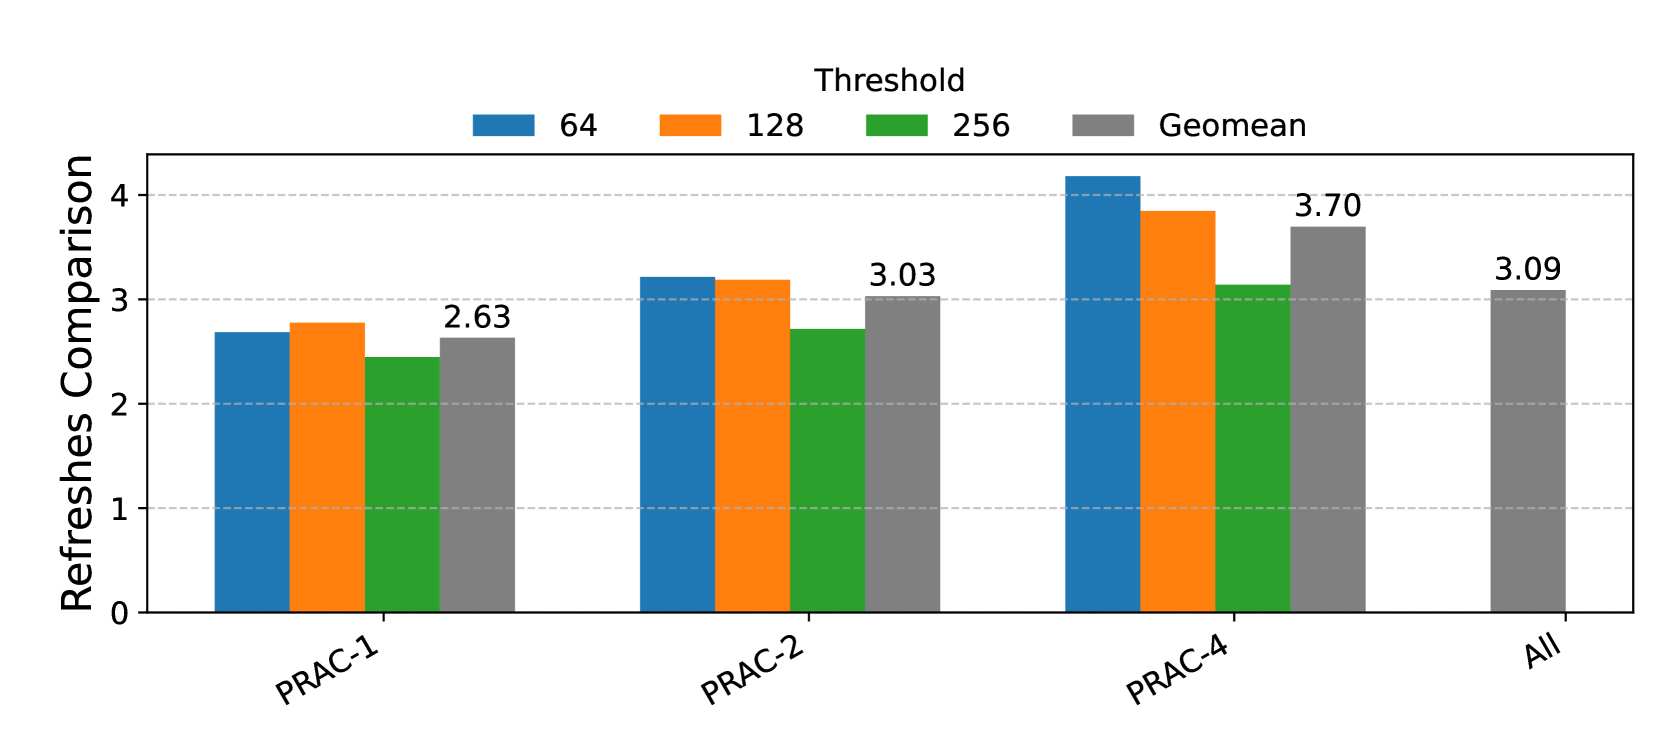
- **Type**: Bar Chart
- **Title**: "Threshold"
- **Primary Purpose**: Comparing refresh rates across different thresholds and categories
## 2. Legend Analysis
- **Position**: Top of chart
- **Color-Coded Labels**:
- Blue: Threshold 64
- Orange: Threshold 128
- Green: Threshold 256
- Gray: Geomean
- **Spatial Grounding**:
- X-axis: Categories (Prac-1, Prac-2, Prac-4, All)
- Y-axis: Numerical values (0-4)
## 3. Axis Labels
- **X-axis**:
- Categories: Prac-1, Prac-2, Prac-4, All
- Label: "Refreshes Comparison"
- **Y-axis**:
- Scale: 0 to 4 (increment: 1)
- Label: "Refreshes Comparison"
## 4. Data Points & Trends
### Prac-1
- **Threshold 64 (Blue)**: ~2.63
- **Threshold 128 (Orange)**: ~2.75
- **Threshold 256 (Green)**: ~2.45
- **Geomean (Gray)**: 2.63
- **Trend**: Orange > Blue = Gray > Green
### Prac-2
- **Threshold 64 (Blue)**: 3.03
- **Threshold 128 (Orange)**: 3.15
- **Threshold 256 (Green)**: ~2.75
- **Geomean (Gray)**: 3.03
- **Trend**: Orange > Blue = Gray > Green
### Prac-4
- **Threshold 64 (Blue)**: 3.70
- **Threshold 128 (Orange)**: 3.85
- **Threshold 256 (Green)**: ~3.15
- **Geomean (Gray)**: 3.70
- **Trend**: Orange > Blue = Gray > Green
### All
- **Geomean (Gray)**: 3.09
- **Note**: No bars for thresholds 64/128/256 in "All" category
## 5. Key Observations
1. **Threshold Correlation**: Higher thresholds (128 > 64 > 256) generally show increasing refresh rates
2. **Geomean Pattern**: Matches Threshold 64 values in all categories except "All"
3. **Category Progression**:
- Prac-1 (lowest values)
- Prac-2 (mid-range)
- Prac-4 (highest values)
- All (aggregated Geomean)
## 6. Structural Components
- **Header**: Chart title "Threshold" with legend
- **Main Chart**:
- Four vertical bar groups (one per category)
- Four color-coded bars per group (except "All")
- **Footer**: None present
## 7. Data Table Reconstruction
| Category | Threshold 64 | Threshold 128 | Threshold 256 | Geomean |
|----------|--------------|---------------|---------------|---------|
| Prac-1 | 2.63 | 2.75 | 2.45 | 2.63 |
| Prac-2 | 3.03 | 3.15 | 2.75 | 3.03 |
| Prac-4 | 3.70 | 3.85 | 3.15 | 3.70 |
| All | - | - | - | 3.09 |
## 8. Language Notes
- **Primary Language**: English
- **No Additional Languages Detected**
## 9. Critical Validation Checks
1. **Color Consistency**: All legend colors match bar colors in chart
2. **Trend Verification**:
- Orange bars consistently highest
- Green bars consistently lowest
- Blue/Gray bars show identical values in each category
3. **Spatial Accuracy**:
- Legend positioned above chart
- Y-axis values aligned with bar heights
## 10. Missing Elements
- No data table present in original image
- No textual annotations explaining Geomean calculation
- No units specified for refresh rates