## Line Chart: Accuracy vs. Thinking Compute
### Overview
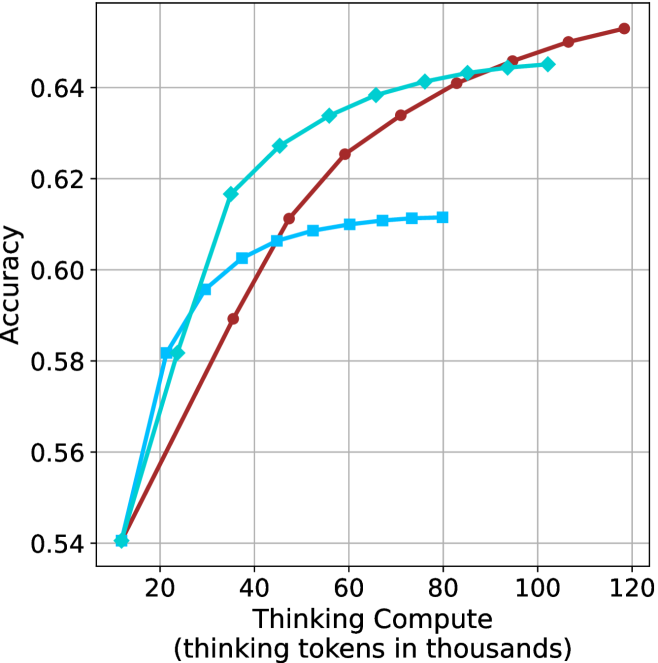
This image presents a line chart illustrating the relationship between "Thinking Compute" (measured in thousands of tokens) and "Accuracy". Three distinct data series are plotted, each represented by a different colored line. The chart appears to demonstrate how accuracy improves with increased computational effort (thinking tokens).
### Components/Axes
* **X-axis:** "Thinking Compute (thinking tokens in thousands)". Scale ranges from approximately 0 to 120, with markers at 20, 40, 60, 80, 100, and 120.
* **Y-axis:** "Accuracy". Scale ranges from approximately 0.54 to 0.65, with markers at 0.54, 0.56, 0.58, 0.60, 0.62, 0.64.
* **Data Series 1:** Cyan line with square markers.
* **Data Series 2:** Red line with circular markers.
* **Data Series 3:** Blue line with diamond markers.
* **Grid:** A light gray grid is present, aiding in the reading of values.
### Detailed Analysis
**Data Series 1 (Cyan, Square Markers):**
The cyan line shows an initially steep upward trend, then plateaus.
* At approximately 20 Thinking Compute, Accuracy is around 0.58.
* At approximately 40 Thinking Compute, Accuracy is around 0.62.
* At approximately 60 Thinking Compute, Accuracy is around 0.61.
* At approximately 80 Thinking Compute, Accuracy is around 0.62.
* At approximately 100 Thinking Compute, Accuracy is around 0.63.
* At approximately 120 Thinking Compute, Accuracy is around 0.64.
**Data Series 2 (Red, Circular Markers):**
The red line exhibits a consistent upward trend throughout the entire range.
* At approximately 20 Thinking Compute, Accuracy is around 0.55.
* At approximately 40 Thinking Compute, Accuracy is around 0.61.
* At approximately 60 Thinking Compute, Accuracy is around 0.63.
* At approximately 80 Thinking Compute, Accuracy is around 0.64.
* At approximately 100 Thinking Compute, Accuracy is around 0.65.
* At approximately 120 Thinking Compute, Accuracy is around 0.65.
**Data Series 3 (Blue, Diamond Markers):**
The blue line shows a rapid initial increase, followed by a leveling off.
* At approximately 20 Thinking Compute, Accuracy is around 0.57.
* At approximately 40 Thinking Compute, Accuracy is around 0.60.
* At approximately 60 Thinking Compute, Accuracy is around 0.61.
* At approximately 80 Thinking Compute, Accuracy is around 0.61.
* At approximately 100 Thinking Compute, Accuracy is around 0.61.
* At approximately 120 Thinking Compute, Accuracy is around 0.61.
### Key Observations
* The red line consistently demonstrates the highest accuracy across all levels of "Thinking Compute".
* The cyan line shows diminishing returns in accuracy as "Thinking Compute" increases beyond 40 thousand tokens.
* The blue line plateaus relatively early, indicating limited benefit from further "Thinking Compute" beyond 40 thousand tokens.
* All three lines show an initial increase in accuracy with increasing "Thinking Compute", suggesting that some level of computational effort is beneficial.
### Interpretation
The chart suggests that increasing "Thinking Compute" generally improves accuracy, but the rate of improvement varies depending on the data series. The red line indicates a model or method that scales well with increased computation, while the cyan and blue lines suggest diminishing returns. This could be due to factors such as model architecture, training data, or optimization algorithms. The differences between the lines could represent different approaches to problem-solving or different levels of model complexity. The plateauing of the cyan and blue lines suggests that there is a limit to the accuracy that can be achieved with the given approach, even with substantial computational resources. The data implies that for the cyan and blue lines, resources could be better allocated elsewhere after a certain point. The chart provides valuable insights into the trade-offs between computational cost and accuracy, which is crucial for optimizing performance and resource allocation in machine learning or AI systems.