## Line Chart: Model Performance vs. Thinking Compute
### Overview
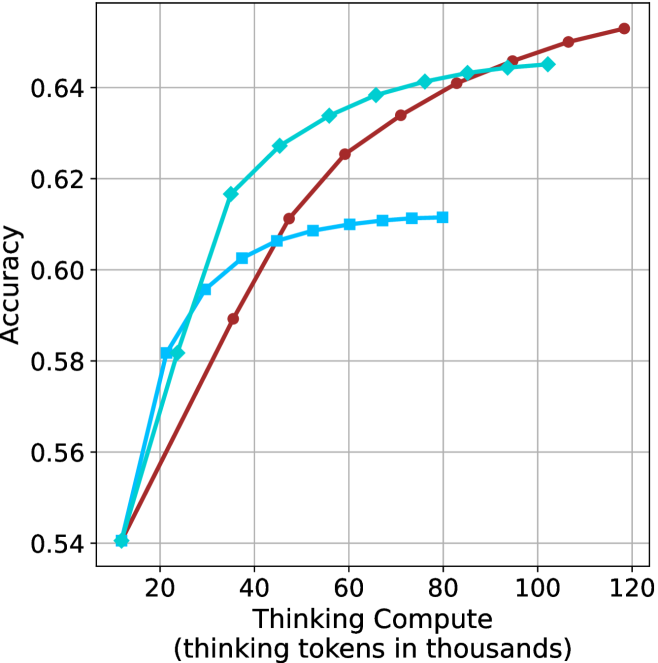
The chart compares the accuracy of three models (Model A, Model B, Model C) as a function of "Thinking Compute" (measured in thousands of thinking tokens). Accuracy is plotted on the y-axis (0.54–0.64), while the x-axis ranges from 20 to 120 thousand tokens. Three distinct lines represent each model's performance trend.
### Components/Axes
- **X-axis**: "Thinking Compute (thinking tokens in thousands)" (20–120k tokens, increments of 20k).
- **Y-axis**: "Accuracy" (0.54–0.64, increments of 0.02).
- **Legend**: Located on the right, associating:
- Teal line → Model A
- Red line → Model B
- Blue line → Model C
### Detailed Analysis
1. **Model A (Teal Line)**:
- Starts at (20k tokens, 0.54 accuracy).
- Sharp upward slope until ~40k tokens (reaches 0.64).
- Plateaus at ~0.64 from 40k to 120k tokens.
2. **Model B (Red Line)**:
- Starts at (20k tokens, 0.54 accuracy).
- Gradual upward slope, surpassing Model A near 60k tokens.
- Reaches ~0.65 accuracy at 120k tokens.
3. **Model C (Blue Line)**:
- Starts at (20k tokens, 0.54 accuracy).
- Slow upward slope, plateauing at ~0.61 by 80k tokens.
- Remains flat at ~0.61 until 120k tokens.
### Key Observations
- **Crossover Point**: Model B overtakes Model A in accuracy between 40k and 60k tokens.
- **Plateaus**:
- Model A plateaus at 0.64 after 40k tokens.
- Model C plateaus at 0.61 after 80k tokens.
- **Efficiency**: Model B achieves the highest accuracy (0.65) with the least compute (120k tokens).
### Interpretation
The data suggests **Model B** is the most efficient, achieving superior accuracy with increasing compute. Model A demonstrates rapid early gains but suffers from diminishing returns, while Model C shows minimal improvement despite higher compute. The crossover between Model A and B highlights a critical threshold where compute efficiency becomes decisive. This could inform resource allocation strategies, favoring Model B for high-accuracy, compute-constrained scenarios.