## Line Chart: Question vs. Thinking Importance Scores
### Overview
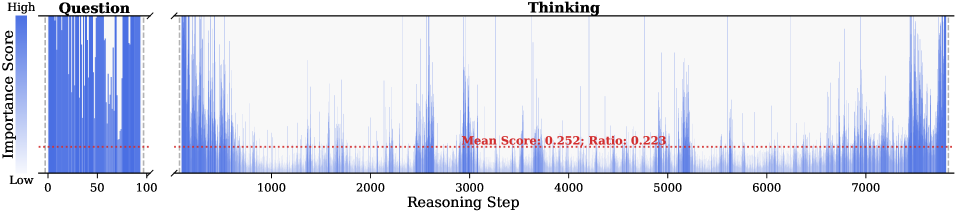
The image displays a line chart comparing importance scores across two phases: "Question" (left) and "Thinking" (right). The x-axis represents "Reasoning Step" (0–7000), and the y-axis represents "Importance Score" (Low to High). A red dashed line labeled "Mean Score: 0.252; Ratio: 0.223" spans the "Thinking" phase, indicating a baseline metric.
### Components/Axes
- **X-Axis (Reasoning Step)**:
- Left ("Question"): 0–100 (discrete steps).
- Right ("Thinking"): 0–7000 (continuous scale).
- **Y-Axis (Importance Score)**:
- Gradient from blue (Low) to white (High).
- **Legend**:
- Positioned on the left, but no explicit legend labels are visible. Blue lines represent data points.
- **Red Dashed Line**:
- Horizontal line at y ≈ 0.252, labeled with mean score and ratio.
### Detailed Analysis
- **Question Phase (0–100)**:
- Vertical spikes dominate, with importance scores reaching the "High" range (near white).
- Approximately 20–30 peaks per 100 steps, suggesting frequent high-importance moments.
- **Thinking Phase (0–7000)**:
- Sporadic spikes, mostly below the red dashed line (y ≈ 0.252).
- Approximately 5–10 significant peaks per 1000 steps, with most values clustered near the baseline.
- **Red Dashed Line**:
- Mean score of 0.252 (low importance) and ratio of 0.223 (22.3% of "Question" phase peaks).
### Key Observations
1. **High Importance in "Question" Phase**:
- Peaks frequently exceed 0.8 on the importance scale, indicating critical reasoning steps.
2. **Low Baseline in "Thinking" Phase**:
- Most steps cluster near the 0.252 mean, with only rare spikes reaching higher values.
3. **Ratio Discrepancy**:
- The 0.223 ratio suggests the "Thinking" phase's importance is a fraction of the "Question" phase's peaks, despite the latter's lower frequency.
### Interpretation
The data implies that the "Question" phase contains concentrated, high-impact reasoning moments, while the "Thinking" phase is characterized by diffuse, lower-importance steps. The red dashed line acts as a reference, highlighting that even the mean importance in "Thinking" is minimal compared to the "Question" phase. This could reflect a cognitive process where problem identification (Question) drives critical decisions, whereas subsequent analysis (Thinking) involves less decisive, exploratory steps. The ratio of 0.223 underscores a potential inefficiency or divergence in importance distribution between phases.