## Line Chart: Importance Score vs. Reasoning Step
### Overview
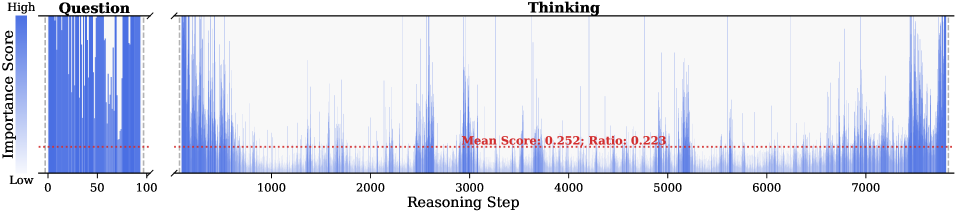
The image presents a line chart illustrating the relationship between "Reasoning Step" and "Importance Score". The chart appears to represent the evolution of importance during a problem-solving or reasoning process, divided into "Question" and "Thinking" phases. The y-axis represents the "Importance Score" ranging from "Low" to "High", while the x-axis represents the "Reasoning Step" from 0 to approximately 7500. A horizontal dashed line indicates the "Mean Score" and "Ratio".
### Components/Axes
* **X-axis:** "Reasoning Step" - Scale from 0 to approximately 7500.
* **Y-axis:** "Importance Score" - Qualitative scale labeled "Low" at the bottom and "High" at the top.
* **Title:** Not explicitly present, but the chart depicts "Importance Score vs. Reasoning Step".
* **Phases:** The chart is divided into two phases labeled "Question" (from 0 to approximately 100) and "Thinking" (from approximately 100 to 7500).
* **Mean Score Line:** A horizontal dashed red line indicating the average importance score.
* **Mean Score Text:** "Mean Score: 0.252; Ratio: 0.223"
* **Data Series:** A single blue line representing the importance score over reasoning steps.
### Detailed Analysis
The blue line representing the "Importance Score" exhibits a distinct pattern.
* **Question Phase (0-100 Reasoning Steps):** The line starts at a low importance score and rapidly increases to a high importance score within the first 100 reasoning steps. The line fluctuates significantly within this range.
* **Thinking Phase (100-7500 Reasoning Steps):** After the initial spike, the importance score generally decreases and stabilizes around the mean score. The line continues to fluctuate, but the amplitude of the fluctuations is smaller than in the "Question" phase. There are occasional spikes in importance, but they are less frequent and less pronounced.
* **Mean Score:** The horizontal dashed red line is positioned at approximately 0.252 on the "Importance Score" axis.
* **Ratio:** The text indicates a "Ratio" of 0.223, but its meaning is not explicitly defined within the chart.
Approximate data points (reading from the chart):
* Step 0: Importance Score ~ 0.05
* Step 50: Importance Score ~ 0.6
* Step 100: Importance Score ~ 0.4
* Step 1000: Importance Score ~ 0.2
* Step 2000: Importance Score ~ 0.3
* Step 3000: Importance Score ~ 0.2
* Step 4000: Importance Score ~ 0.25
* Step 5000: Importance Score ~ 0.2
* Step 6000: Importance Score ~ 0.28
* Step 7000: Importance Score ~ 0.22
* Step 7500: Importance Score ~ 0.23
### Key Observations
* The "Question" phase is characterized by a rapid increase and high variability in importance.
* The "Thinking" phase exhibits a more stable, but still fluctuating, importance score around the mean.
* The importance score generally decreases after the initial "Question" phase.
* The "Ratio" value (0.223) is provided, but its significance is unclear without further context.
### Interpretation
The chart suggests a process where initial problem formulation ("Question" phase) involves a rapid assessment of importance, leading to a peak in relevance. As the reasoning process progresses into the "Thinking" phase, the importance score stabilizes, indicating a more focused and sustained level of relevance. The fluctuations within the "Thinking" phase likely represent the exploration of different ideas or aspects of the problem. The mean importance score provides a baseline for evaluating the overall relevance of the reasoning process.
The sharp transition between the "Question" and "Thinking" phases suggests a shift in cognitive strategy. The initial phase is exploratory and dynamic, while the subsequent phase is more deliberate and analytical. The decreasing trend in importance after the initial spike could indicate that the most critical aspects of the problem have been identified, and the subsequent reasoning steps focus on refining and elaborating on those aspects.
The "Ratio" value might represent a measure of efficiency or effectiveness, but its precise meaning requires additional information. It could be the ratio of important steps to total steps, or some other metric related to the reasoning process.