\n
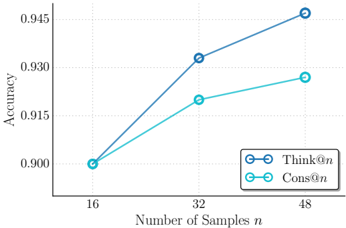
## Line Chart: Accuracy vs. Number of Samples
### Overview
This image presents a line chart comparing the accuracy of two methods, "Think@n" and "Cons@n", as a function of the number of samples (n). The chart displays accuracy on the y-axis and the number of samples on the x-axis.
### Components/Axes
* **X-axis Title:** "Number of Samples n"
* **Y-axis Title:** "Accuracy"
* **X-axis Markers:** 16, 32, 48
* **Y-axis Scale:** Approximately 0.900 to 0.945
* **Legend:** Located in the bottom-right corner.
* "Think@n" - Represented by a dark blue line with circle markers.
* "Cons@n" - Represented by a light blue line with circle markers.
### Detailed Analysis
* **Think@n (Dark Blue Line):** The line slopes upward consistently.
* At n = 16, Accuracy ≈ 0.900
* At n = 32, Accuracy ≈ 0.931
* At n = 48, Accuracy ≈ 0.946
* **Cons@n (Light Blue Line):** The line also slopes upward, but with a less steep incline than "Think@n".
* At n = 16, Accuracy ≈ 0.900
* At n = 32, Accuracy ≈ 0.916
* At n = 48, Accuracy ≈ 0.928
### Key Observations
* Both methods show an increase in accuracy as the number of samples increases.
* "Think@n" consistently outperforms "Cons@n" across all sample sizes.
* The difference in accuracy between the two methods widens as the number of samples increases.
### Interpretation
The data suggests that increasing the number of samples improves the accuracy of both "Think@n" and "Cons@n" methods. However, "Think@n" demonstrates a more significant improvement in accuracy with increasing sample size, indicating it is more sensitive to data volume or benefits more from larger datasets. The consistent outperformance of "Think@n" suggests it may be a more effective method overall, or that it has a different underlying mechanism that scales better with data. The relatively small difference in accuracy at n=16 suggests that the methods are comparable with limited data, but the divergence at n=48 indicates a substantial difference in performance with more data. This could be due to the algorithms used, the data itself, or the way the accuracy is being measured. Further investigation would be needed to determine the root cause of these differences.