## Line Graph: Accuracy vs. Number of Samples
### Overview
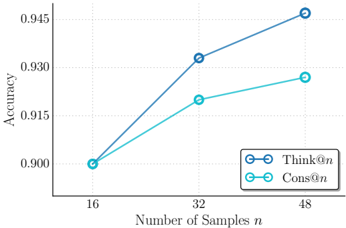
The image is a line graph comparing the accuracy of two methods, "Think@n" and "Cons@n," across different numbers of samples (n). The x-axis represents the number of samples (16, 32, 48), and the y-axis represents accuracy (ranging from 0.900 to 0.945). Two lines are plotted: a blue line for "Think@n" and a teal line for "Cons@n," with data points marked as circles connected by lines.
### Components/Axes
- **X-axis (Horizontal)**: Labeled "Number of Samples n," with discrete ticks at 16, 32, and 48.
- **Y-axis (Vertical)**: Labeled "Accuracy," scaled from 0.900 to 0.945 in increments of 0.005.
- **Legend**: Located in the bottom-right corner, with:
- **Blue line**: "Think@n"
- **Teal line**: "Cons@n"
- **Data Points**: Circles connected by lines for both methods.
### Detailed Analysis
#### Think@n (Blue Line)
- **16 samples**: Accuracy ≈ 0.900
- **32 samples**: Accuracy ≈ 0.930
- **48 samples**: Accuracy ≈ 0.945
- **Trend**: Steep upward slope, indicating significant improvement in accuracy as sample size increases.
#### Cons@n (Teal Line)
- **16 samples**: Accuracy ≈ 0.900
- **32 samples**: Accuracy ≈ 0.915
- **48 samples**: Accuracy ≈ 0.925
- **Trend**: Gradual upward slope, showing slower improvement compared to "Think@n."
### Key Observations
1. Both methods start at the same accuracy (0.900) for 16 samples.
2. "Think@n" outperforms "Cons@n" at all sample sizes beyond 16.
3. The accuracy gap between the two methods widens as the number of samples increases (e.g., 0.015 difference at 48 samples).
4. "Think@n" achieves near-maximum accuracy (0.945) at 48 samples, while "Cons@n" plateaus at 0.925.
### Interpretation
The data suggests that "Think@n" is more effective at leveraging additional samples to improve accuracy compared to "Cons@n." The steeper slope of "Think@n" implies it may use a more efficient algorithm or better handle larger datasets. The consistent starting point at 16 samples indicates both methods perform similarly with minimal data, but "Think@n" scales better. This could inform decisions about resource allocation or model selection in scenarios where sample size is a limiting factor.